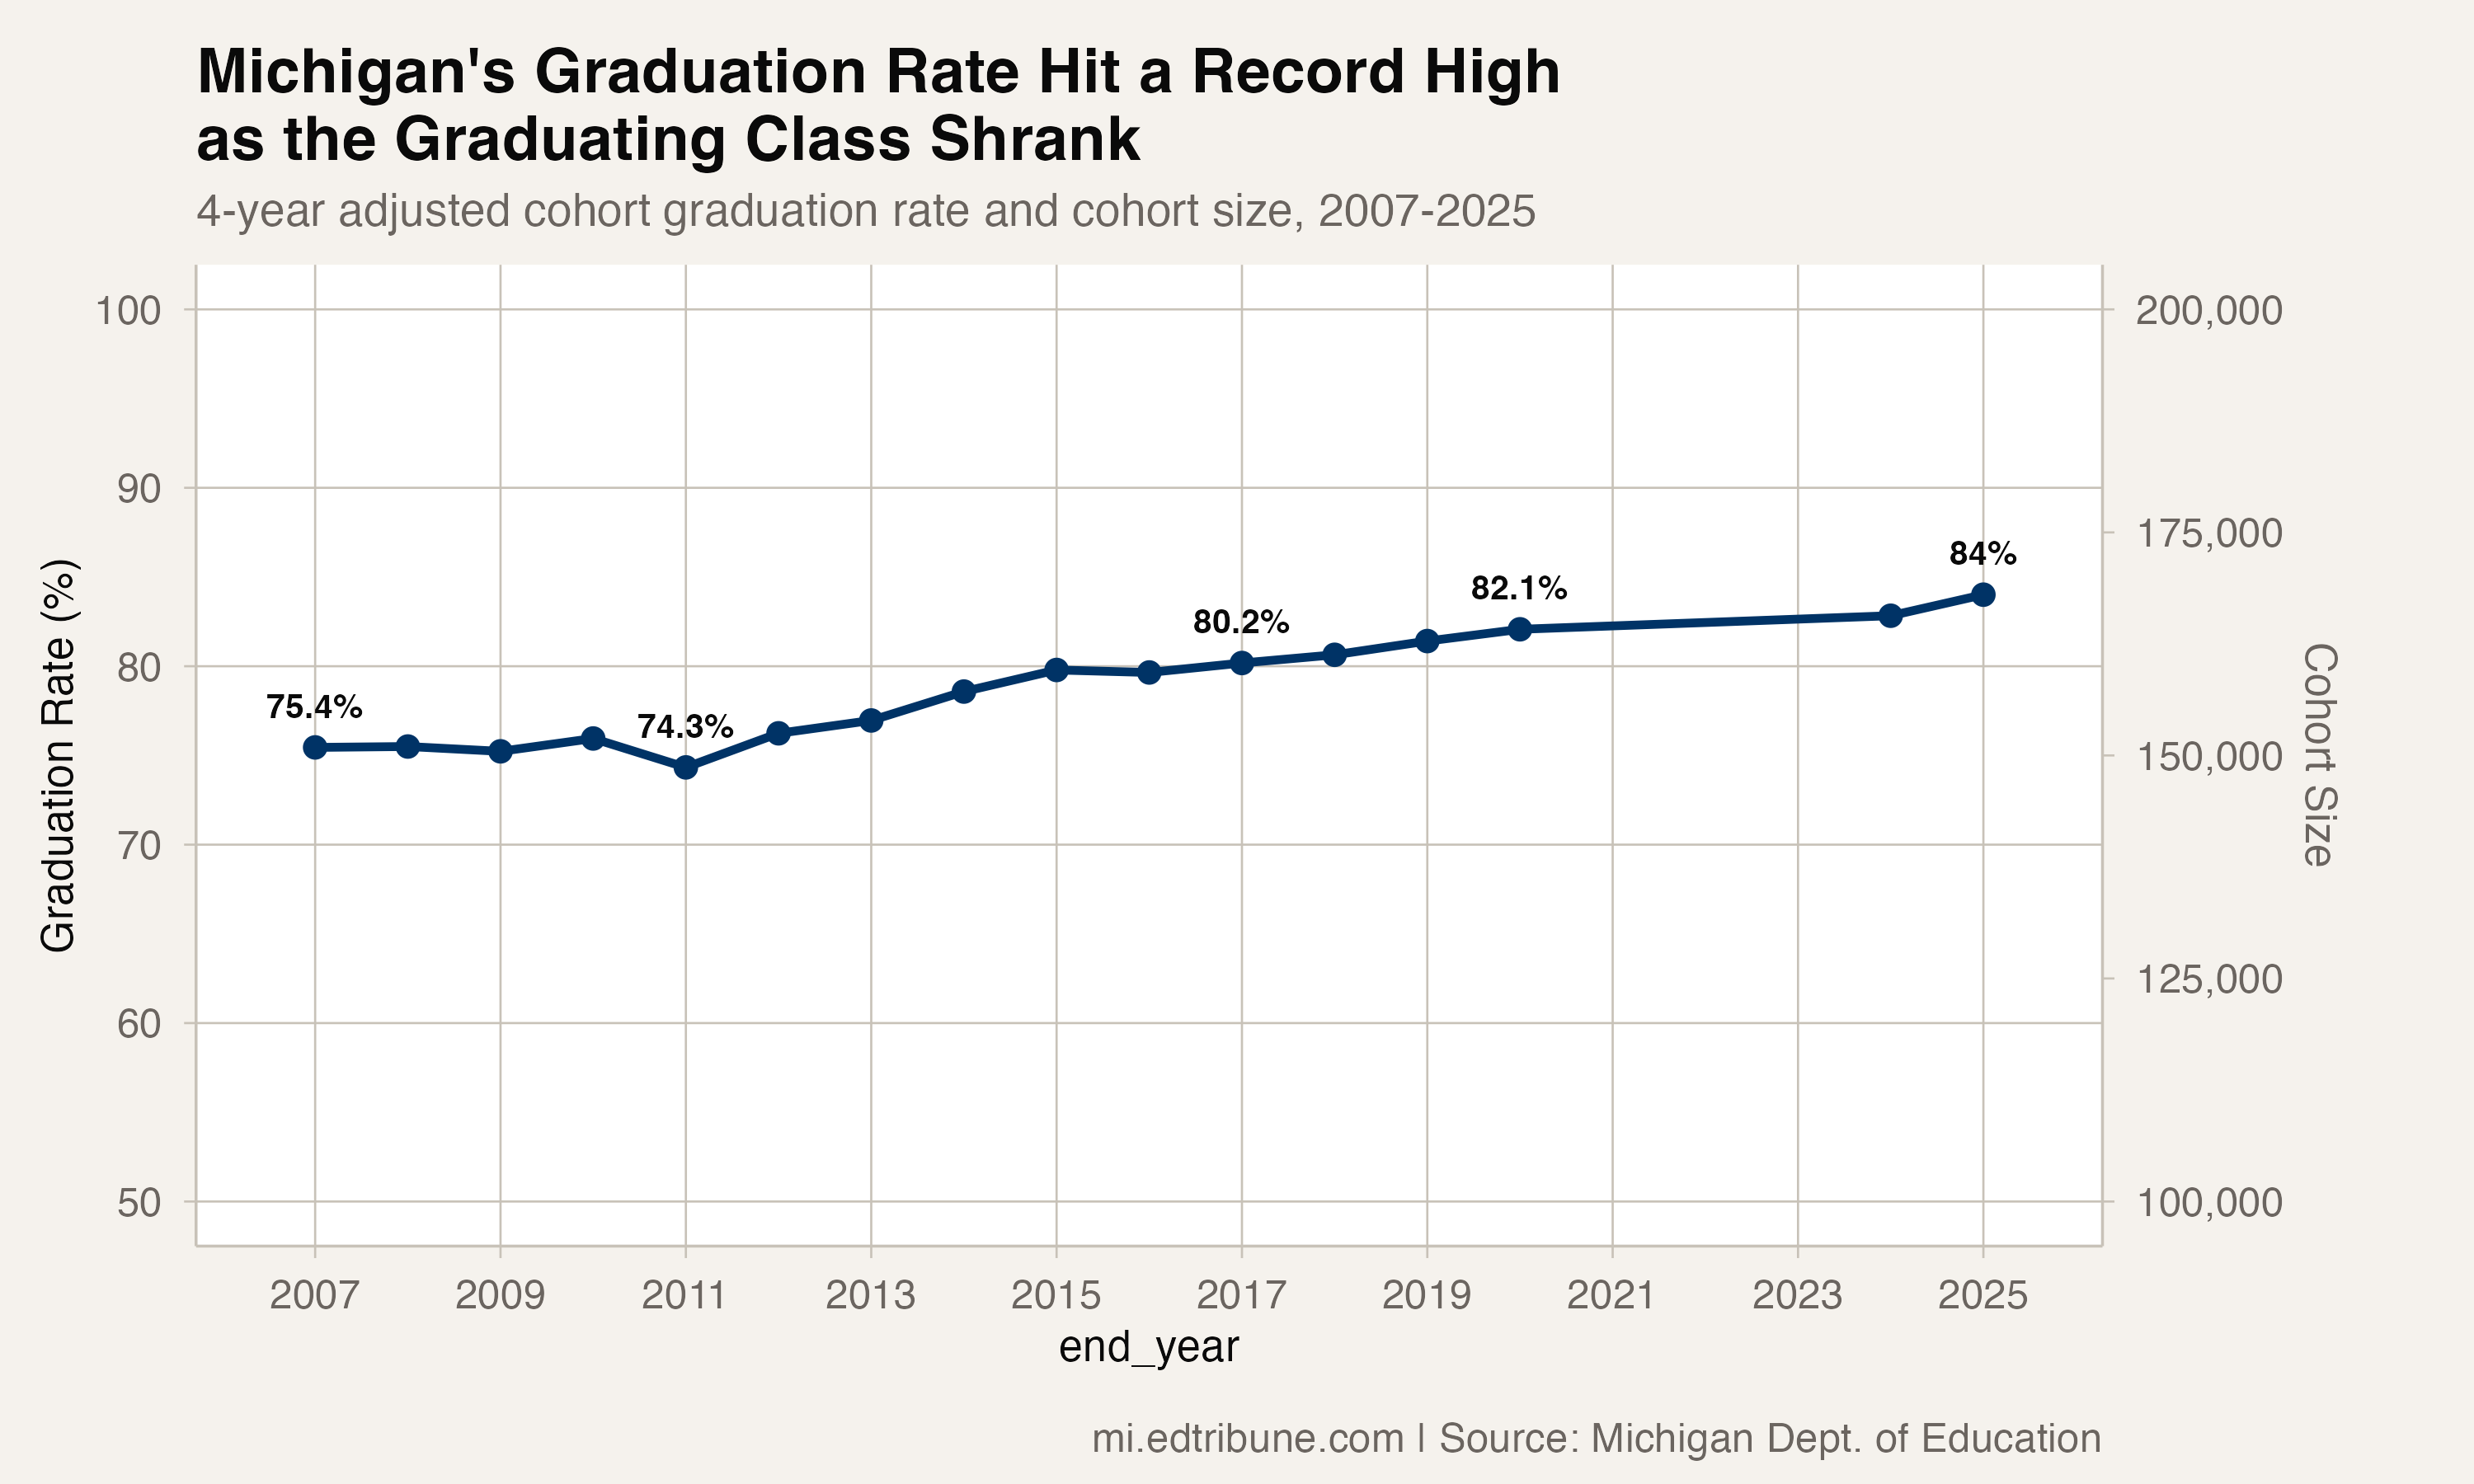
Michigan's four-year graduation rate reached 84.0% in 2025, the highest mark since the state began reporting adjusted cohort rates in 2007. The Class of 2025 walked across stages from Copper Country to Monroe, from the Upper Peninsula to the Thumb, and 84 out of every 100 of them finished on time.
That number is real. It is the product of a long climb -- from 75.4% in 2007 through a 74.3% trough in 2011, past the 80% milestone in 2017, and now to a record that would have seemed unlikely a decade ago.
But the number comes with an asterisk that no press release will mention: the cohort producing those graduates has shrunk by more than 29,000 students.
The arithmetic of improvement
In 2008, Michigan's graduating cohort was 145,097 students. By 2025, it fell to 115,489 -- a 20.4% decline. The state is graduating a higher share of a smaller pool.
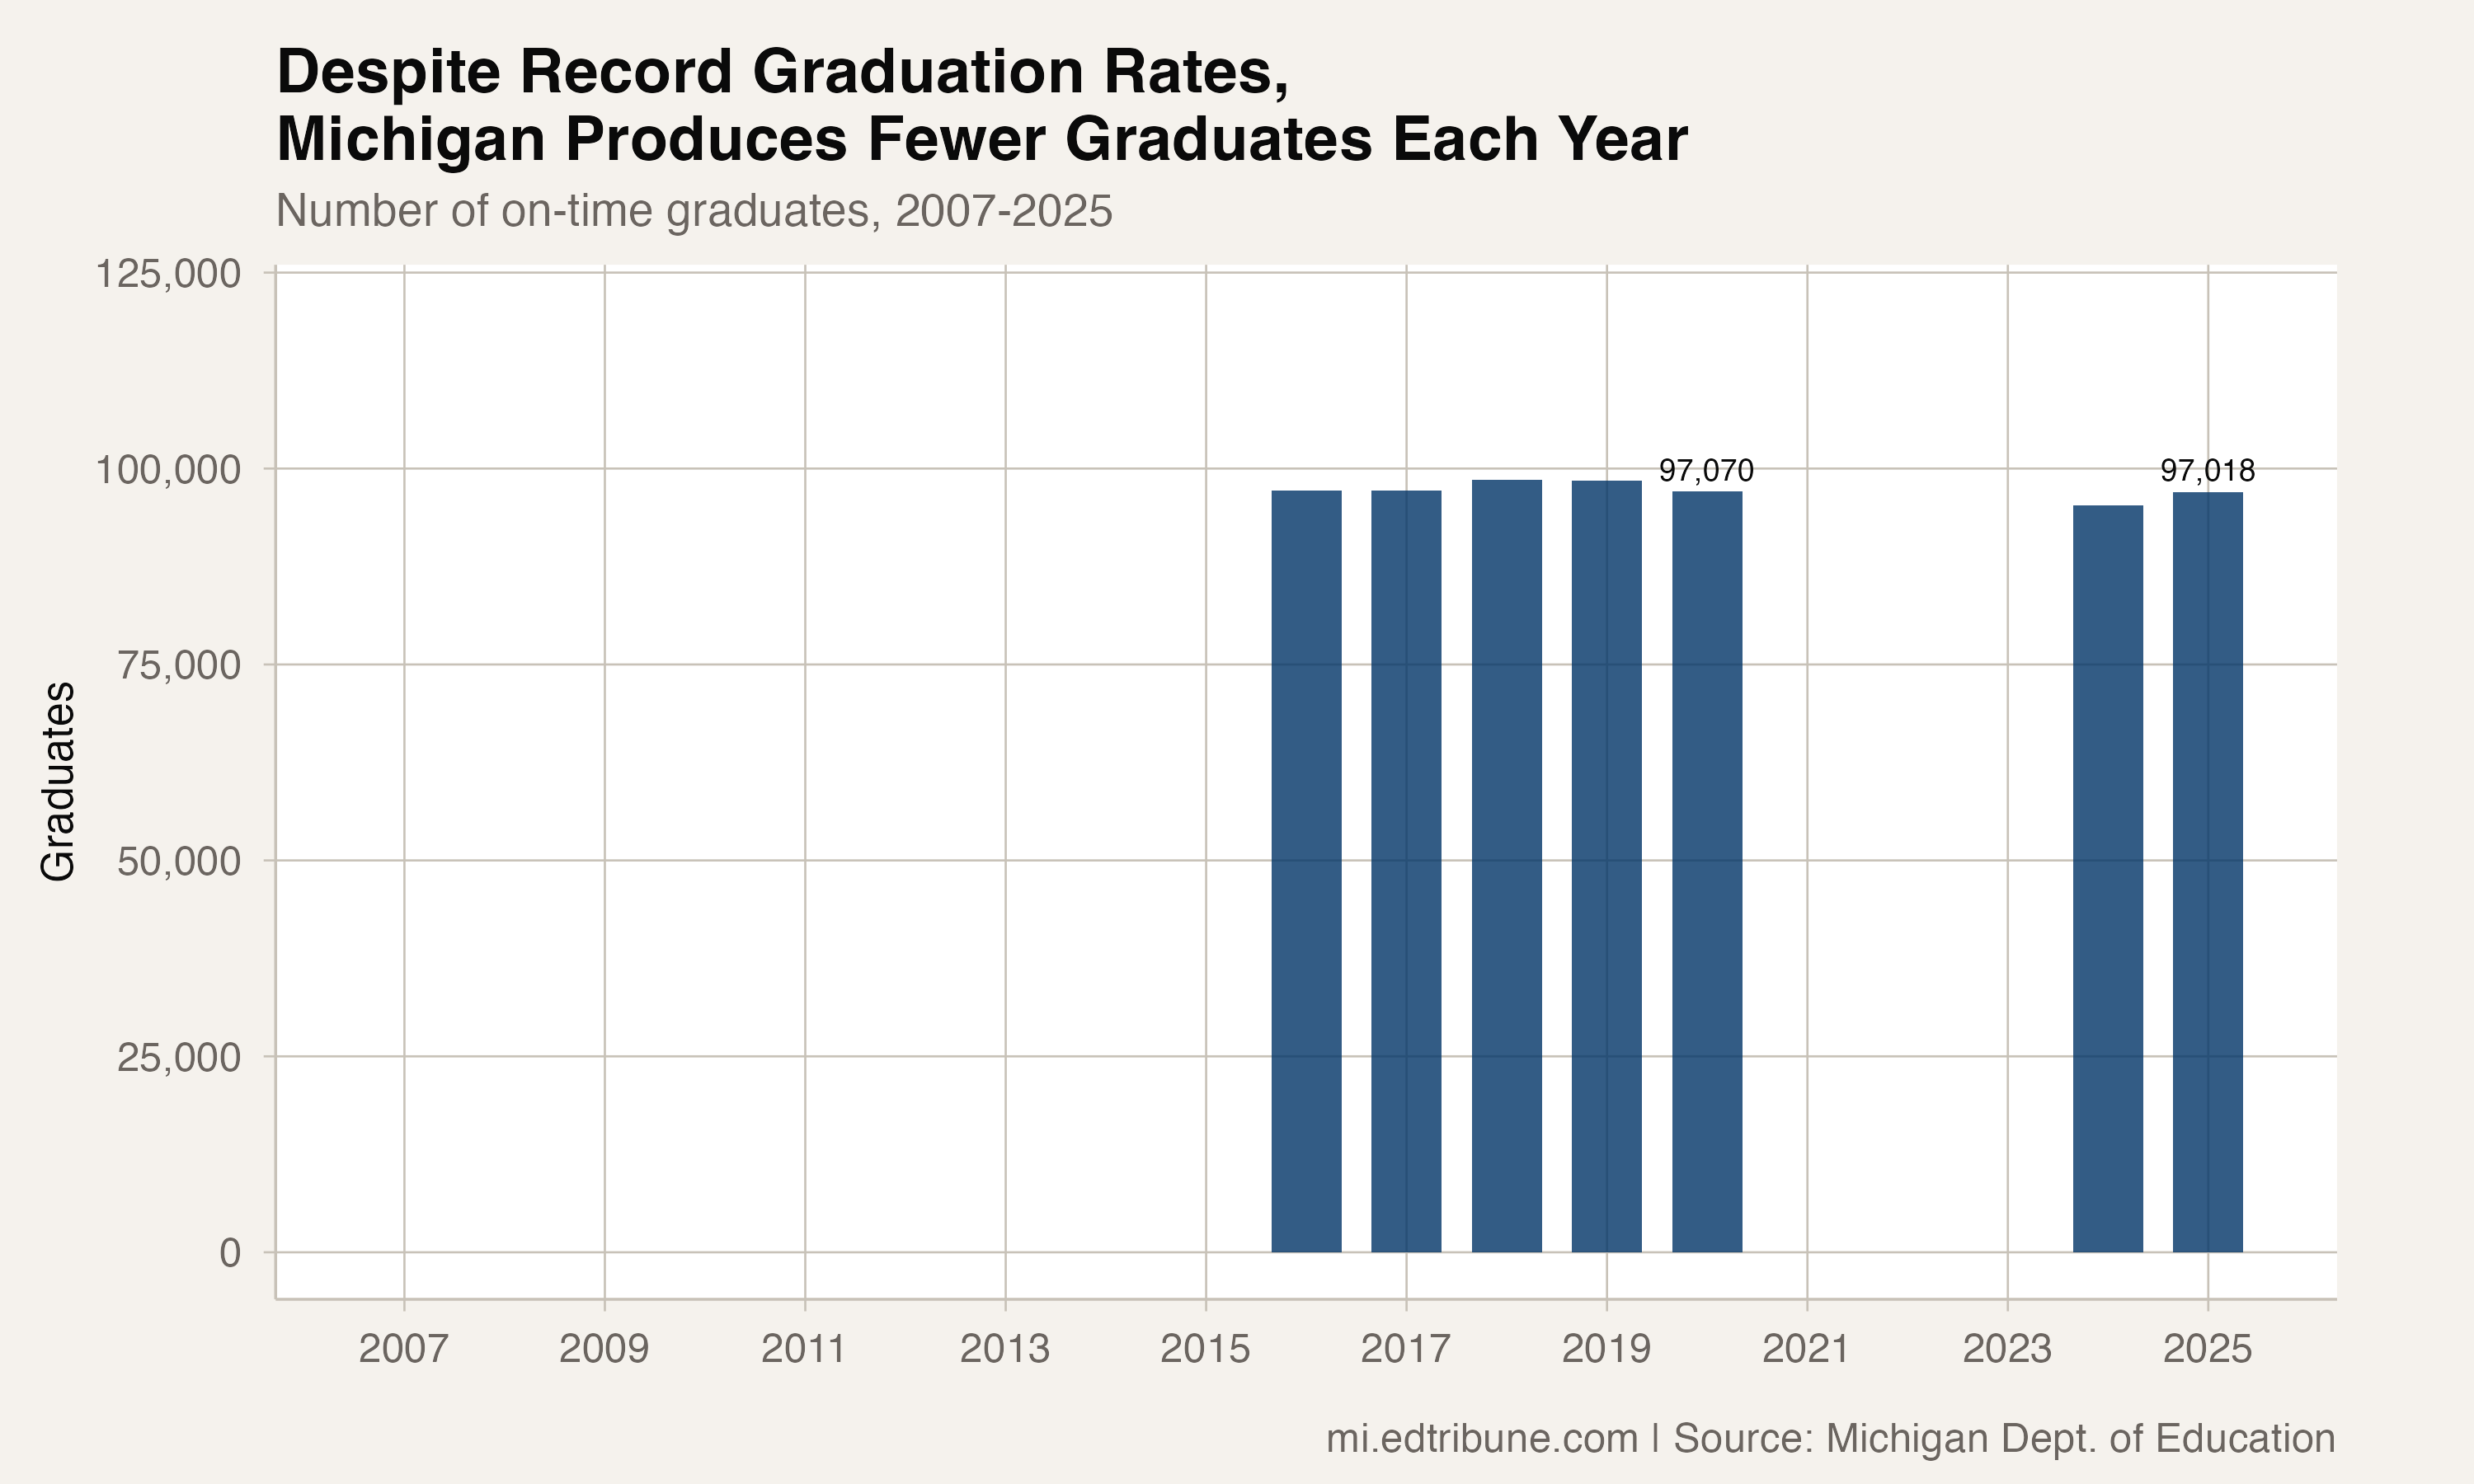
The difference shows up in the only count that matters to employers, colleges, and communities: actual graduates. Michigan produced 97,018 on-time graduates in 2025. That is essentially the same number the state produced in 2016, when the graduation rate was 79.6%. Nine years of rate improvement -- from 79.6% to 84.0% -- produced no additional graduates because the cohort kept shrinking underneath.
Climbing a descending escalator
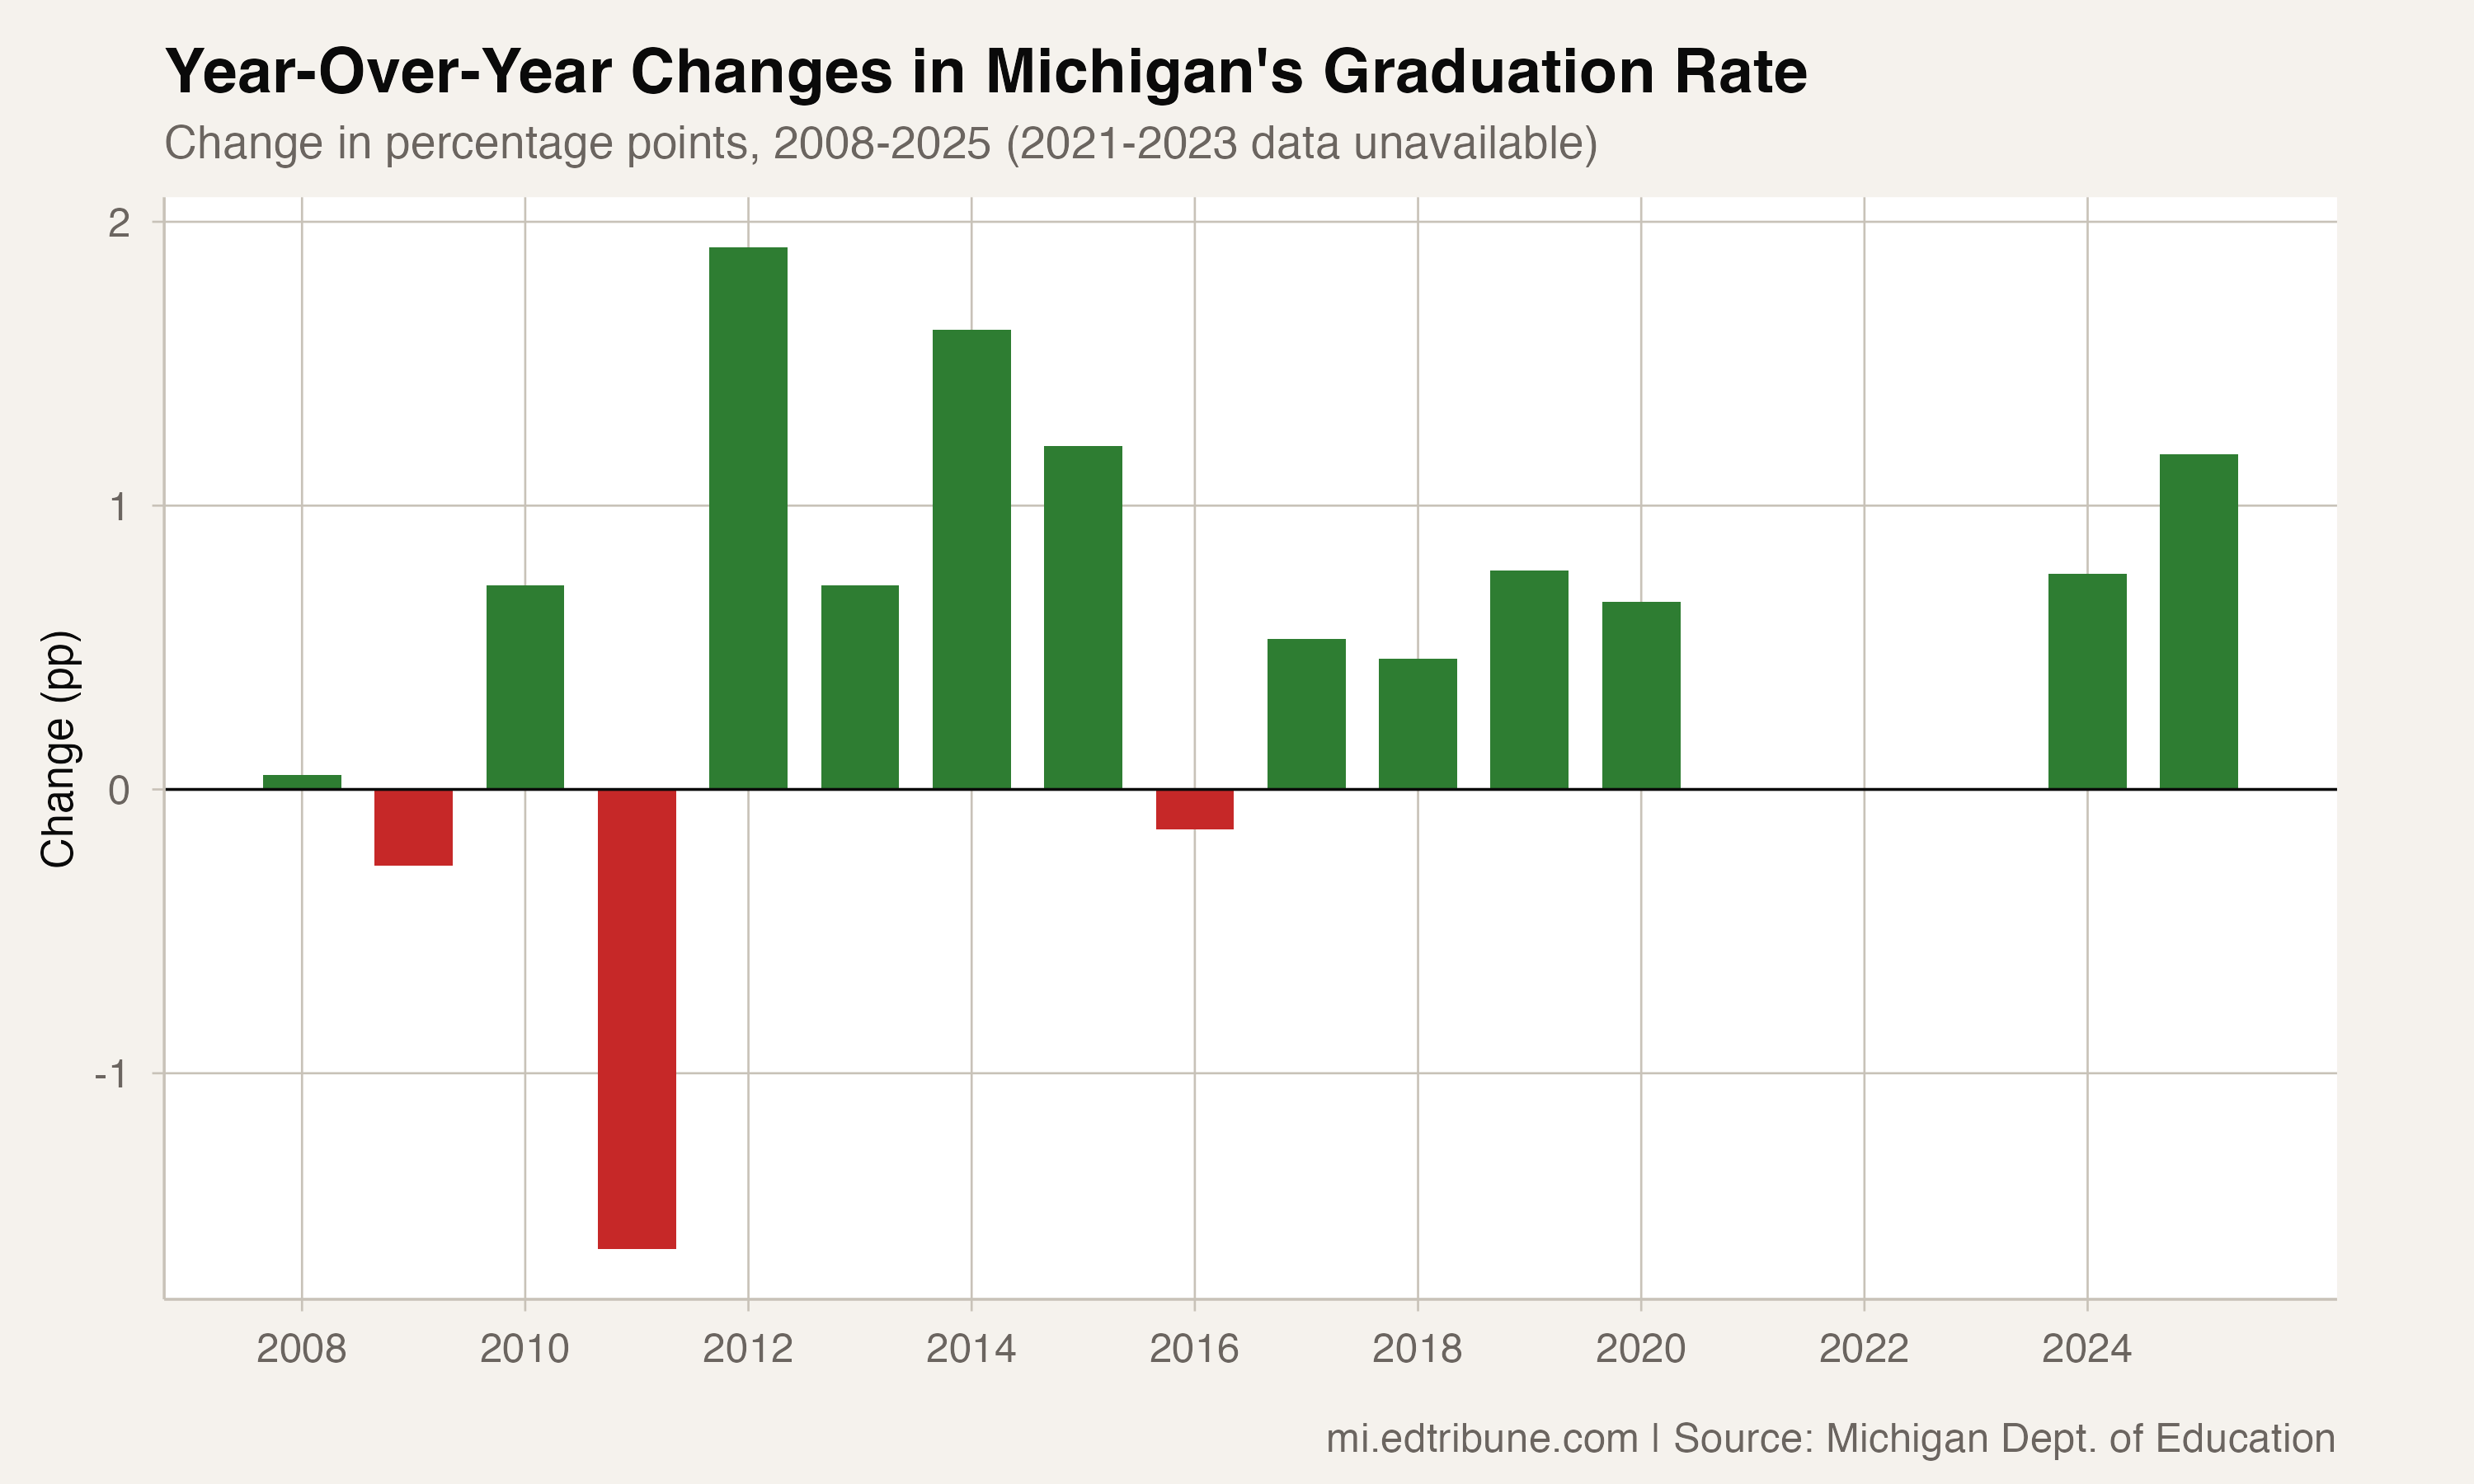
The year-over-year gains tell the mechanical story. Michigan added 0.5 to 2.0 percentage points per year through most of the 2010s, with occasional flat spots. The 2025 gain of 1.2 percentage points was the largest reported gain since 2015. Three years of data are missing -- 2021 through 2023 -- because the state did not report the "all students" subgroup during those years, creating a gap from 2020 to 2024 in the trendline.
What the state accomplished is genuine. A 74.3% rate in 2011 meant roughly one in four students did not finish high school on time. At 84.0%, that number is closer to one in six. In human terms, that is thousands fewer young people each year leaving high school without a diploma.
What the trend can and cannot say
The statewide series can show the rate, the cohort count, and the graduate count. It cannot, by itself, explain why the cohort is smaller or how Michigan compares with states that report under different timelines and definitions.
The rate crossed 75% in 2007, 80% in 2017, and now sits at 84.0%. The next question is whether Michigan can keep improving as the denominator keeps changing.
What a shrinking pipeline means
Fewer students in the measured cohort means fewer potential graduates coming out the other end, even as each student's probability of finishing rises.
For school districts, this creates a paradox. They are doing better work by the measure that matters most to families -- the odds that a child who starts ninth grade will finish twelfth. But the absolute output of the system was roughly flat between 2016 and 2025, because the state was graduating a higher share of a smaller group.
What we are watching
The 2025 gain of 1.2 percentage points was solid, but it came after a three-year data blackout. Whether it represents a true acceleration or a bounce from an unseen dip during 2021-2023 is impossible to know from the available data. We will be examining the district-level patterns that drove this statewide gain in upcoming articles.
By the numbers: Michigan's four-year graduation rate hit 84.0% in 2025 -- an all-time high -- on a cohort of 115,489 students. The cohort has shrunk 20.4% from its 2008 peak of 145,097, and the state produced roughly the same number of graduates (97,018) as it did nine years ago.
Detailed code that reproduces the analysis and figures in this article is available exclusively to EdTribune subscribers.
Discussion
Sign in to join the discussion.
Loading comments...