Correction (August 16, 2026): An earlier version incorrectly said the foster-care series was missing 2021 through 2023, described the gap as continuously widening and said every other subgroup gained three to seven points. The current data show a complete foster-care series for those years, a gap that changed unevenly and several subgroup changes outside that range. This version also removes unsupported explanations for the pattern.
Michigan's published all-students graduation rate rose from 80.6% in 2018 to 84.0% in 2025, a gain of 3.4 percentage points. Over the same span, the rate for students in foster care rose from 40.4% to 41.6%, a gain of 1.2 points.
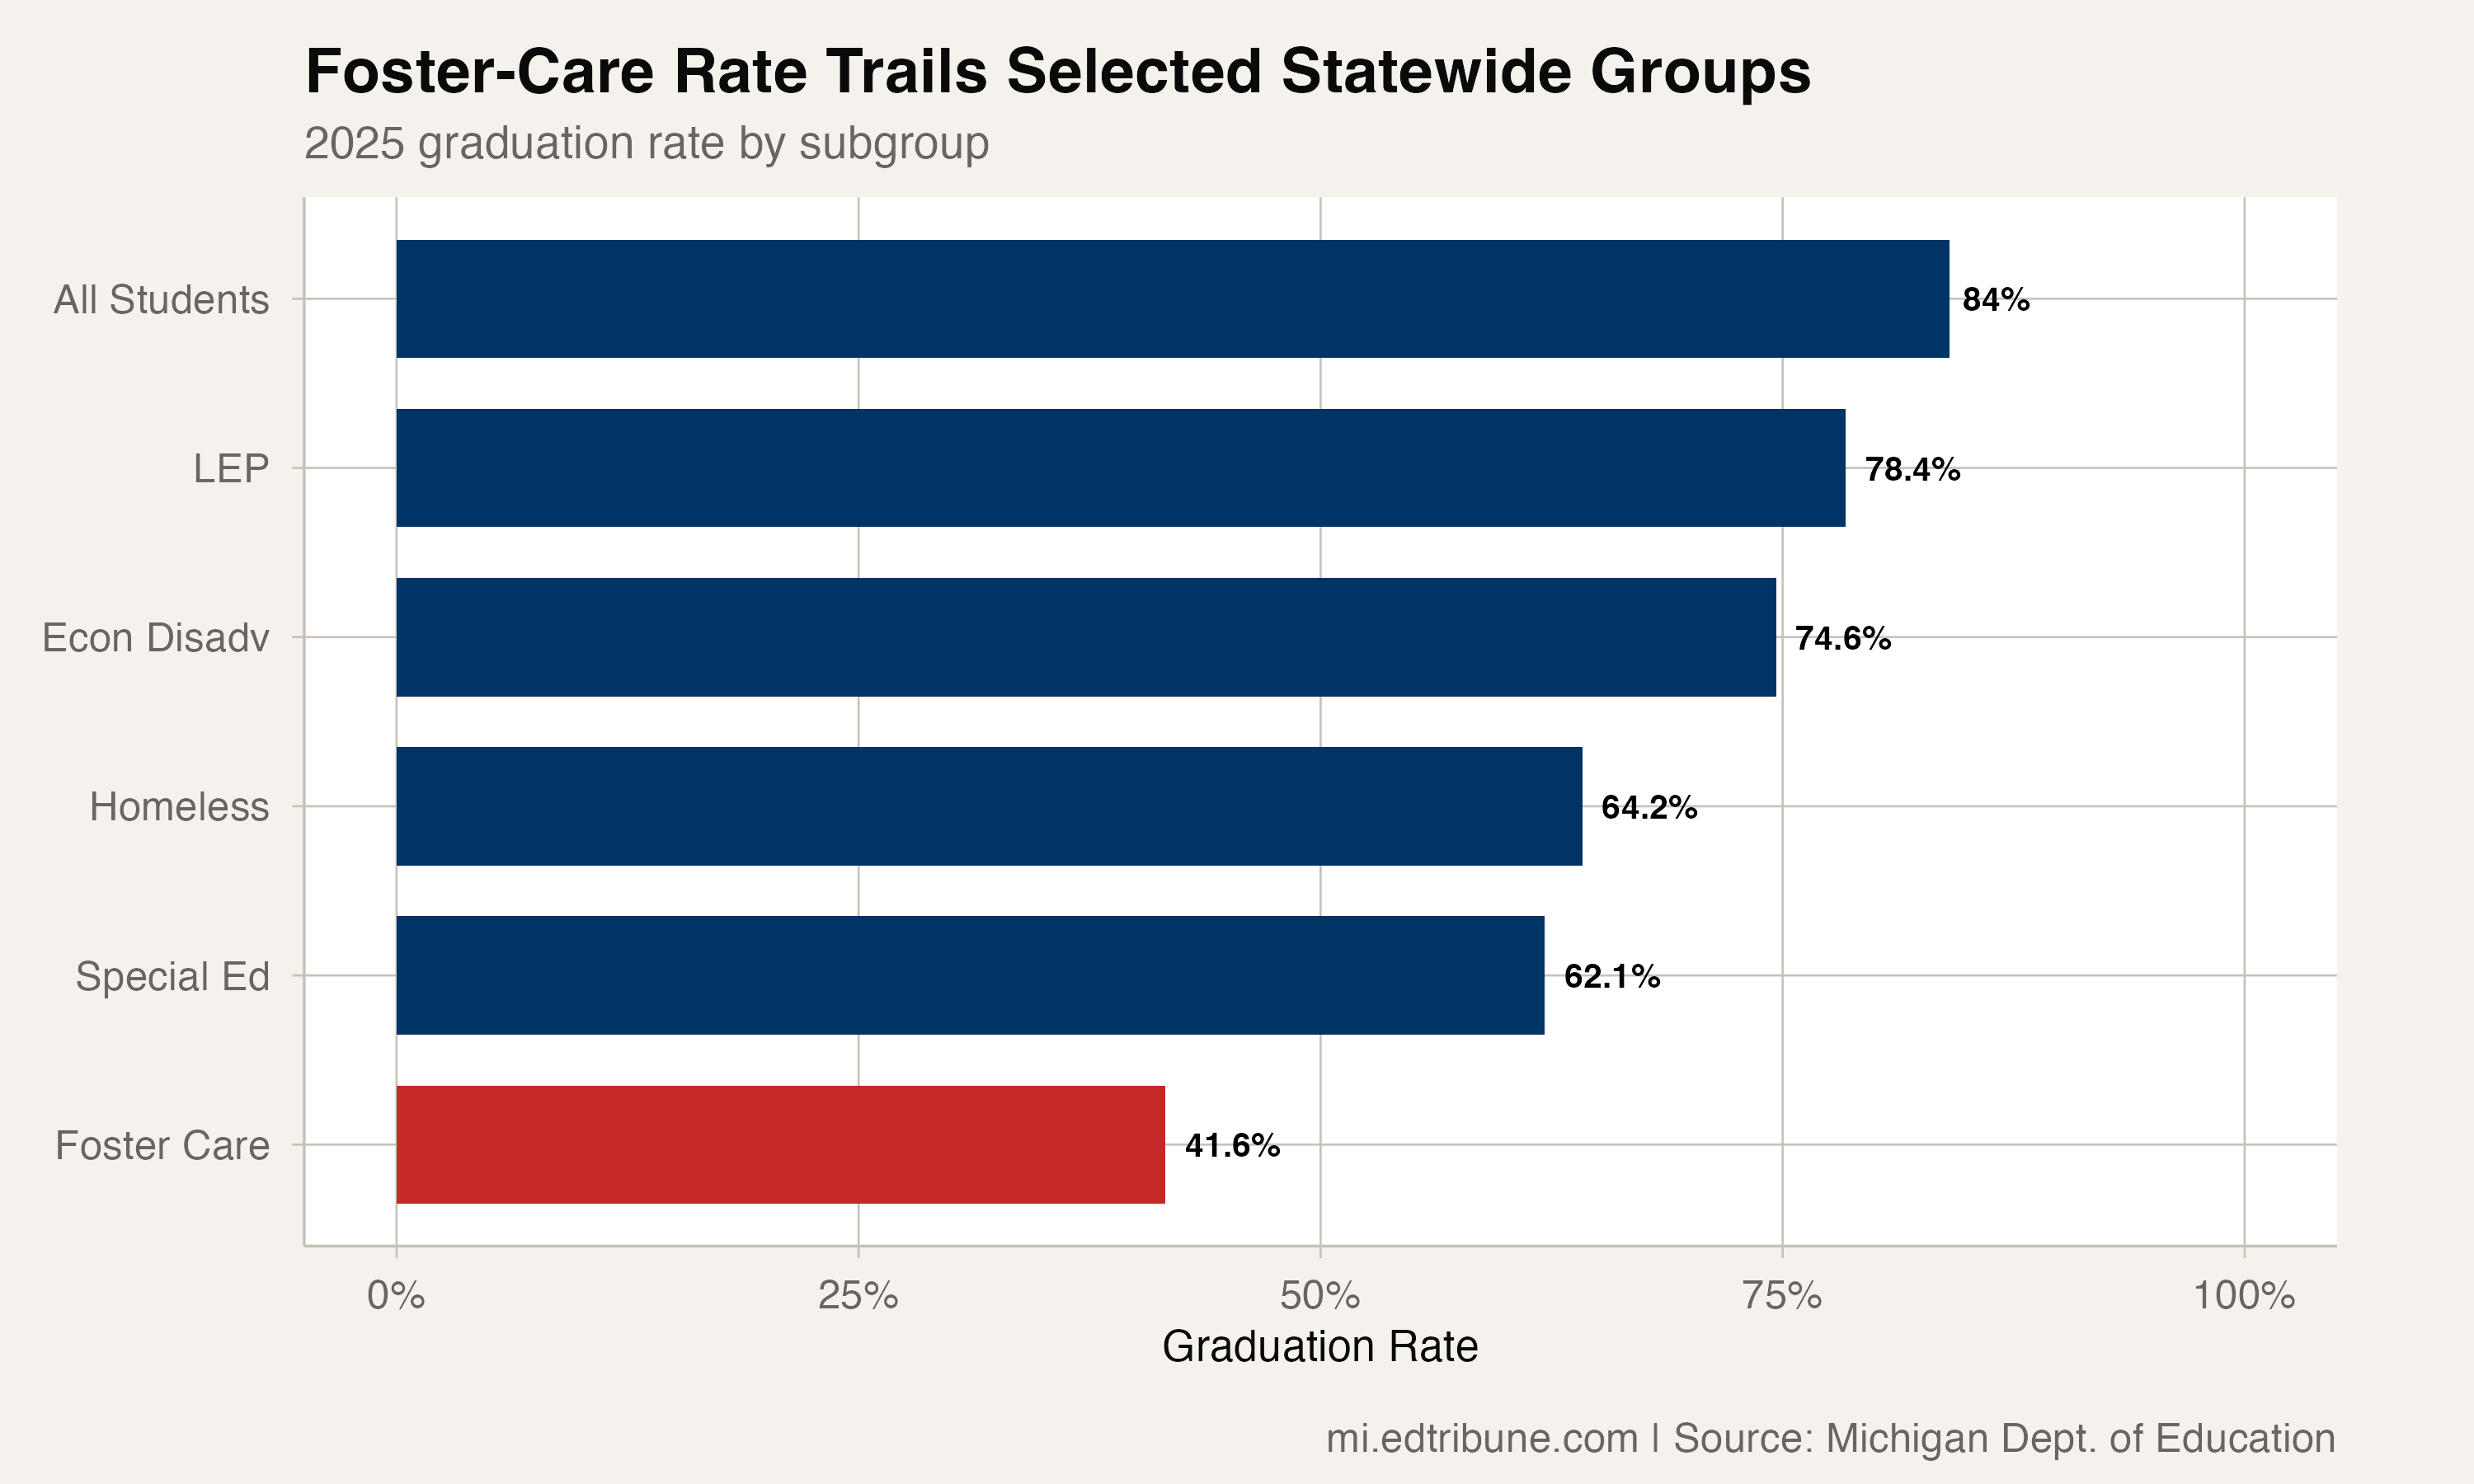
The 2025 foster-care rate was 42.4 points below the all-students rate. It was the lowest of the 18 statewide subgroup rates Michigan published that year.
Eight years of foster-care results
Michigan published a foster-care rate in every reporting year from 2018 through 2025. The rate rose to 43.8% in 2019, fell to 39.7% in 2020 and reached the series low of 39.5% in 2021. It then rose to 41.3% in 2022 and 44.0% in 2023 before moving back to 40.8% in 2024 and 41.6% in 2025.
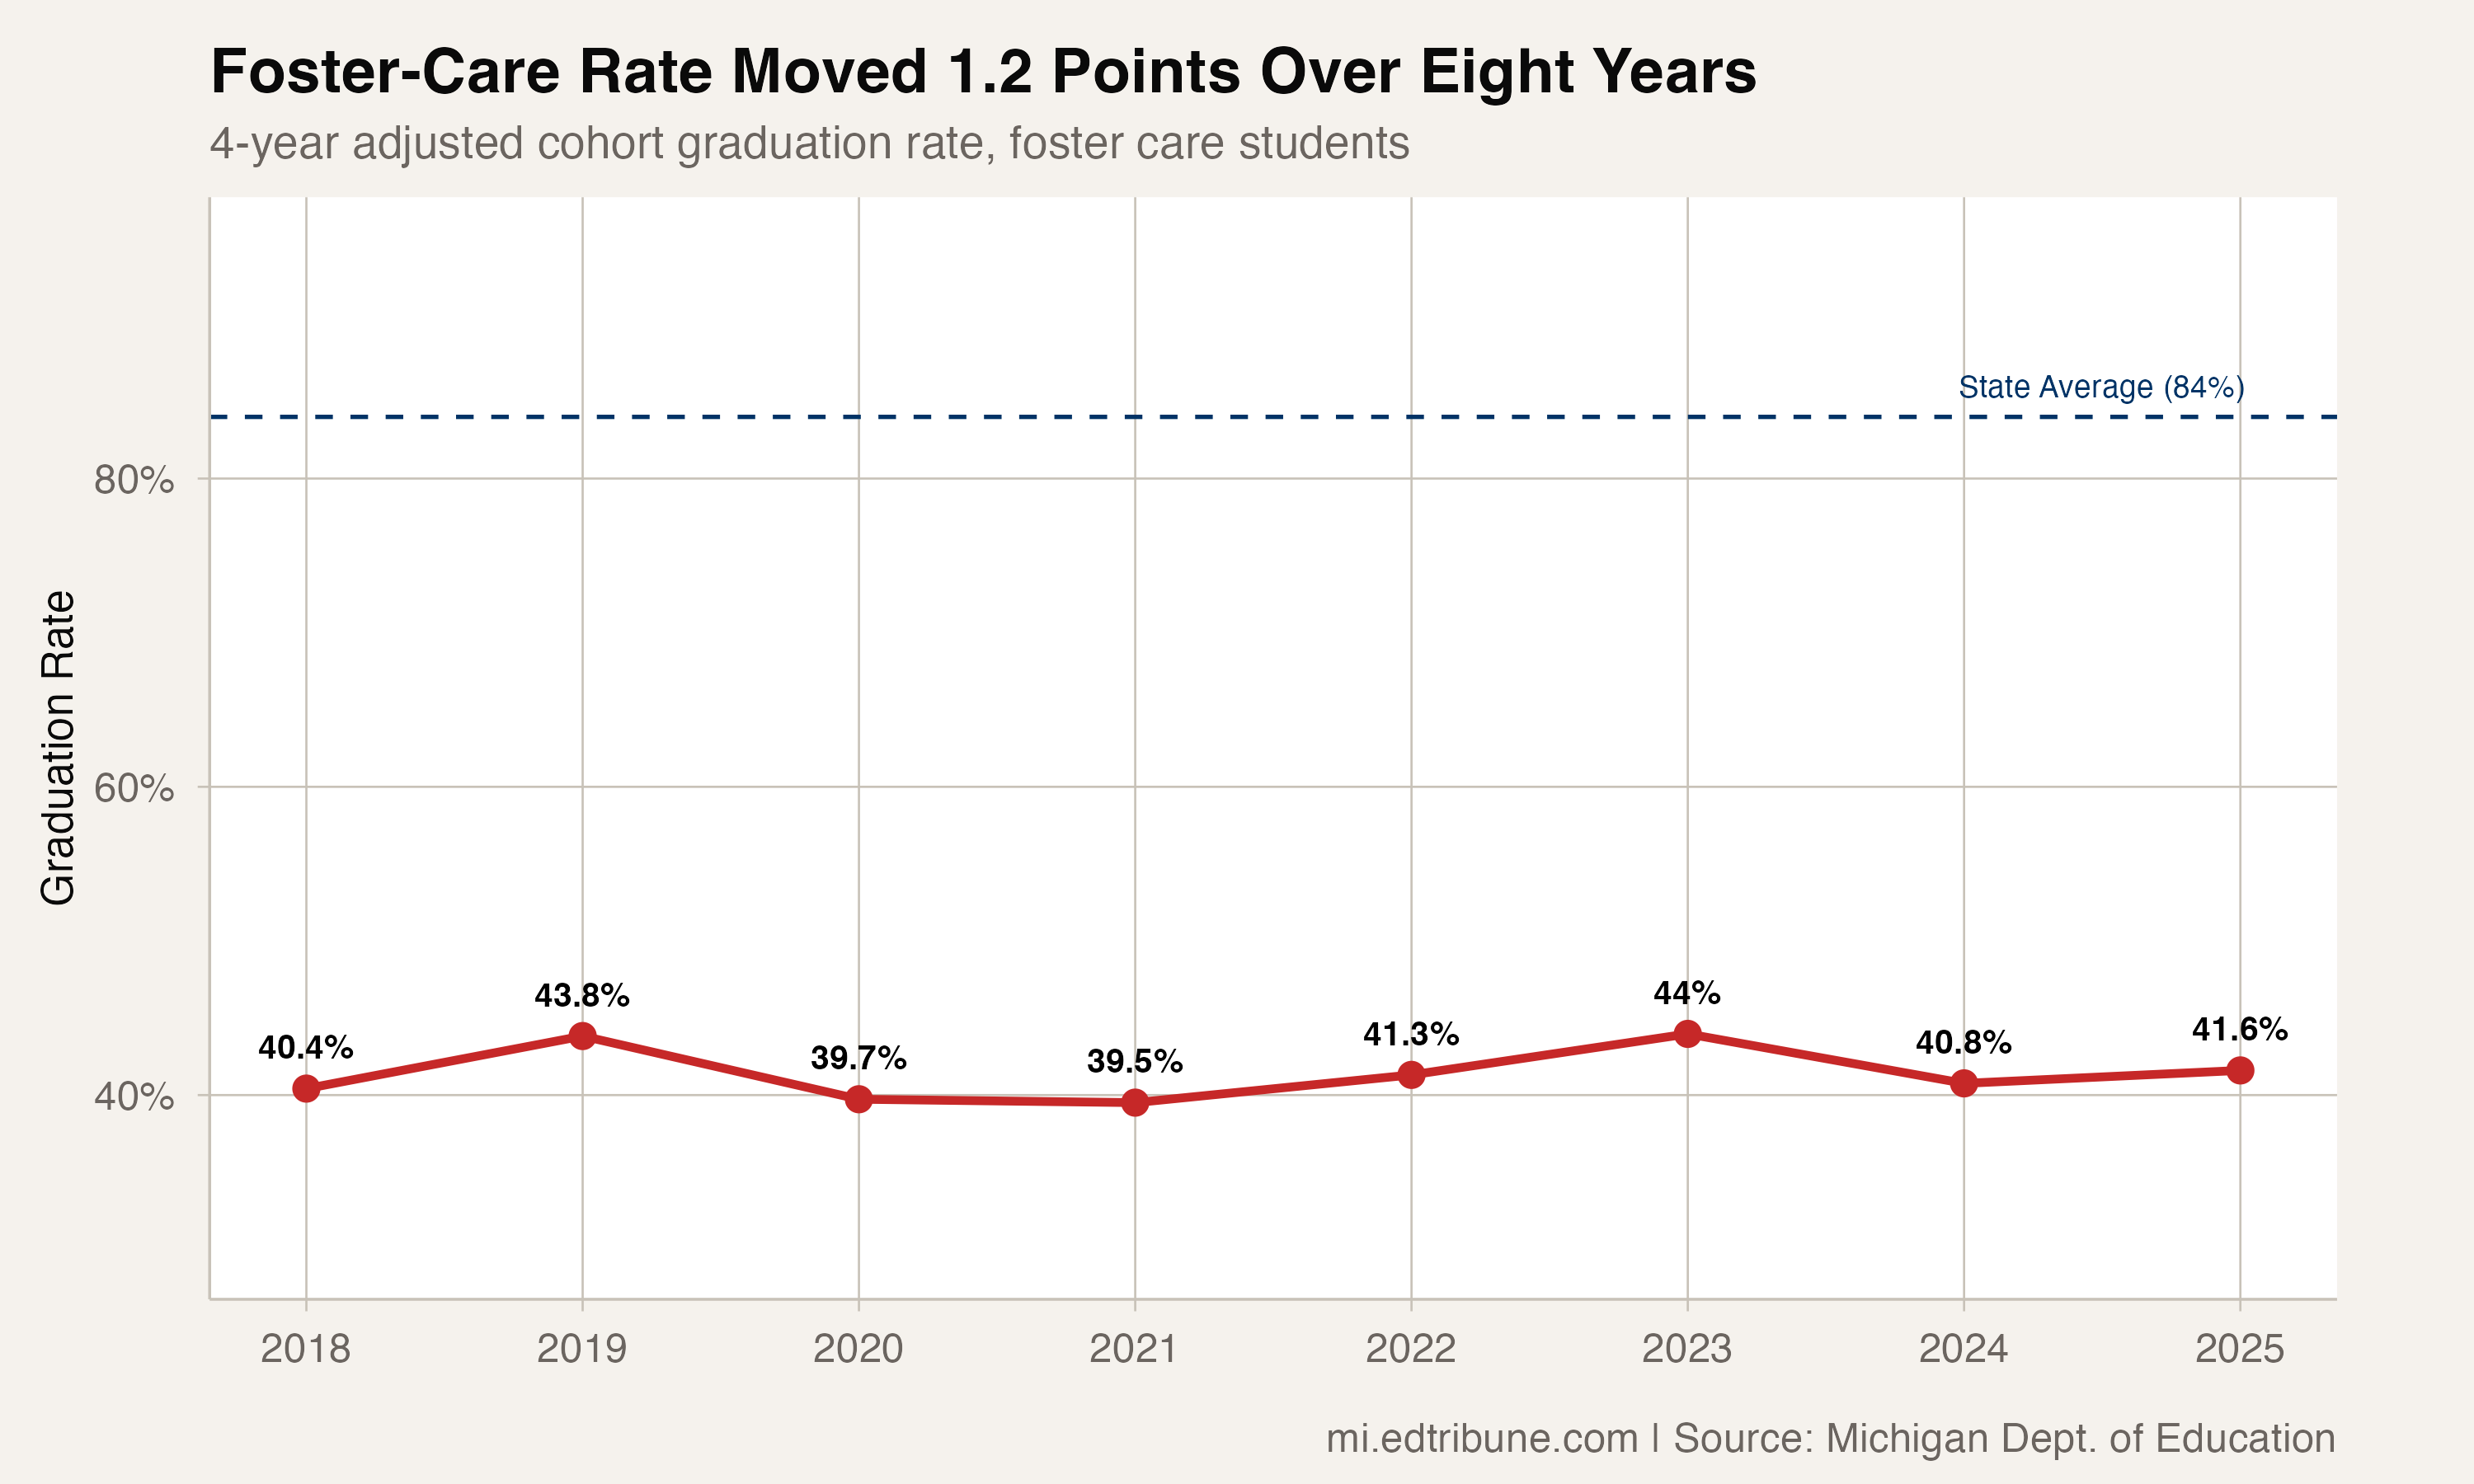
The path matters. The 2025 rate was close to the 2018 starting point, but the intervening years included both the panel's low and high. The data support a small endpoint gain, not a steady rise or decline.
A wide gap, with an incomplete middle comparison
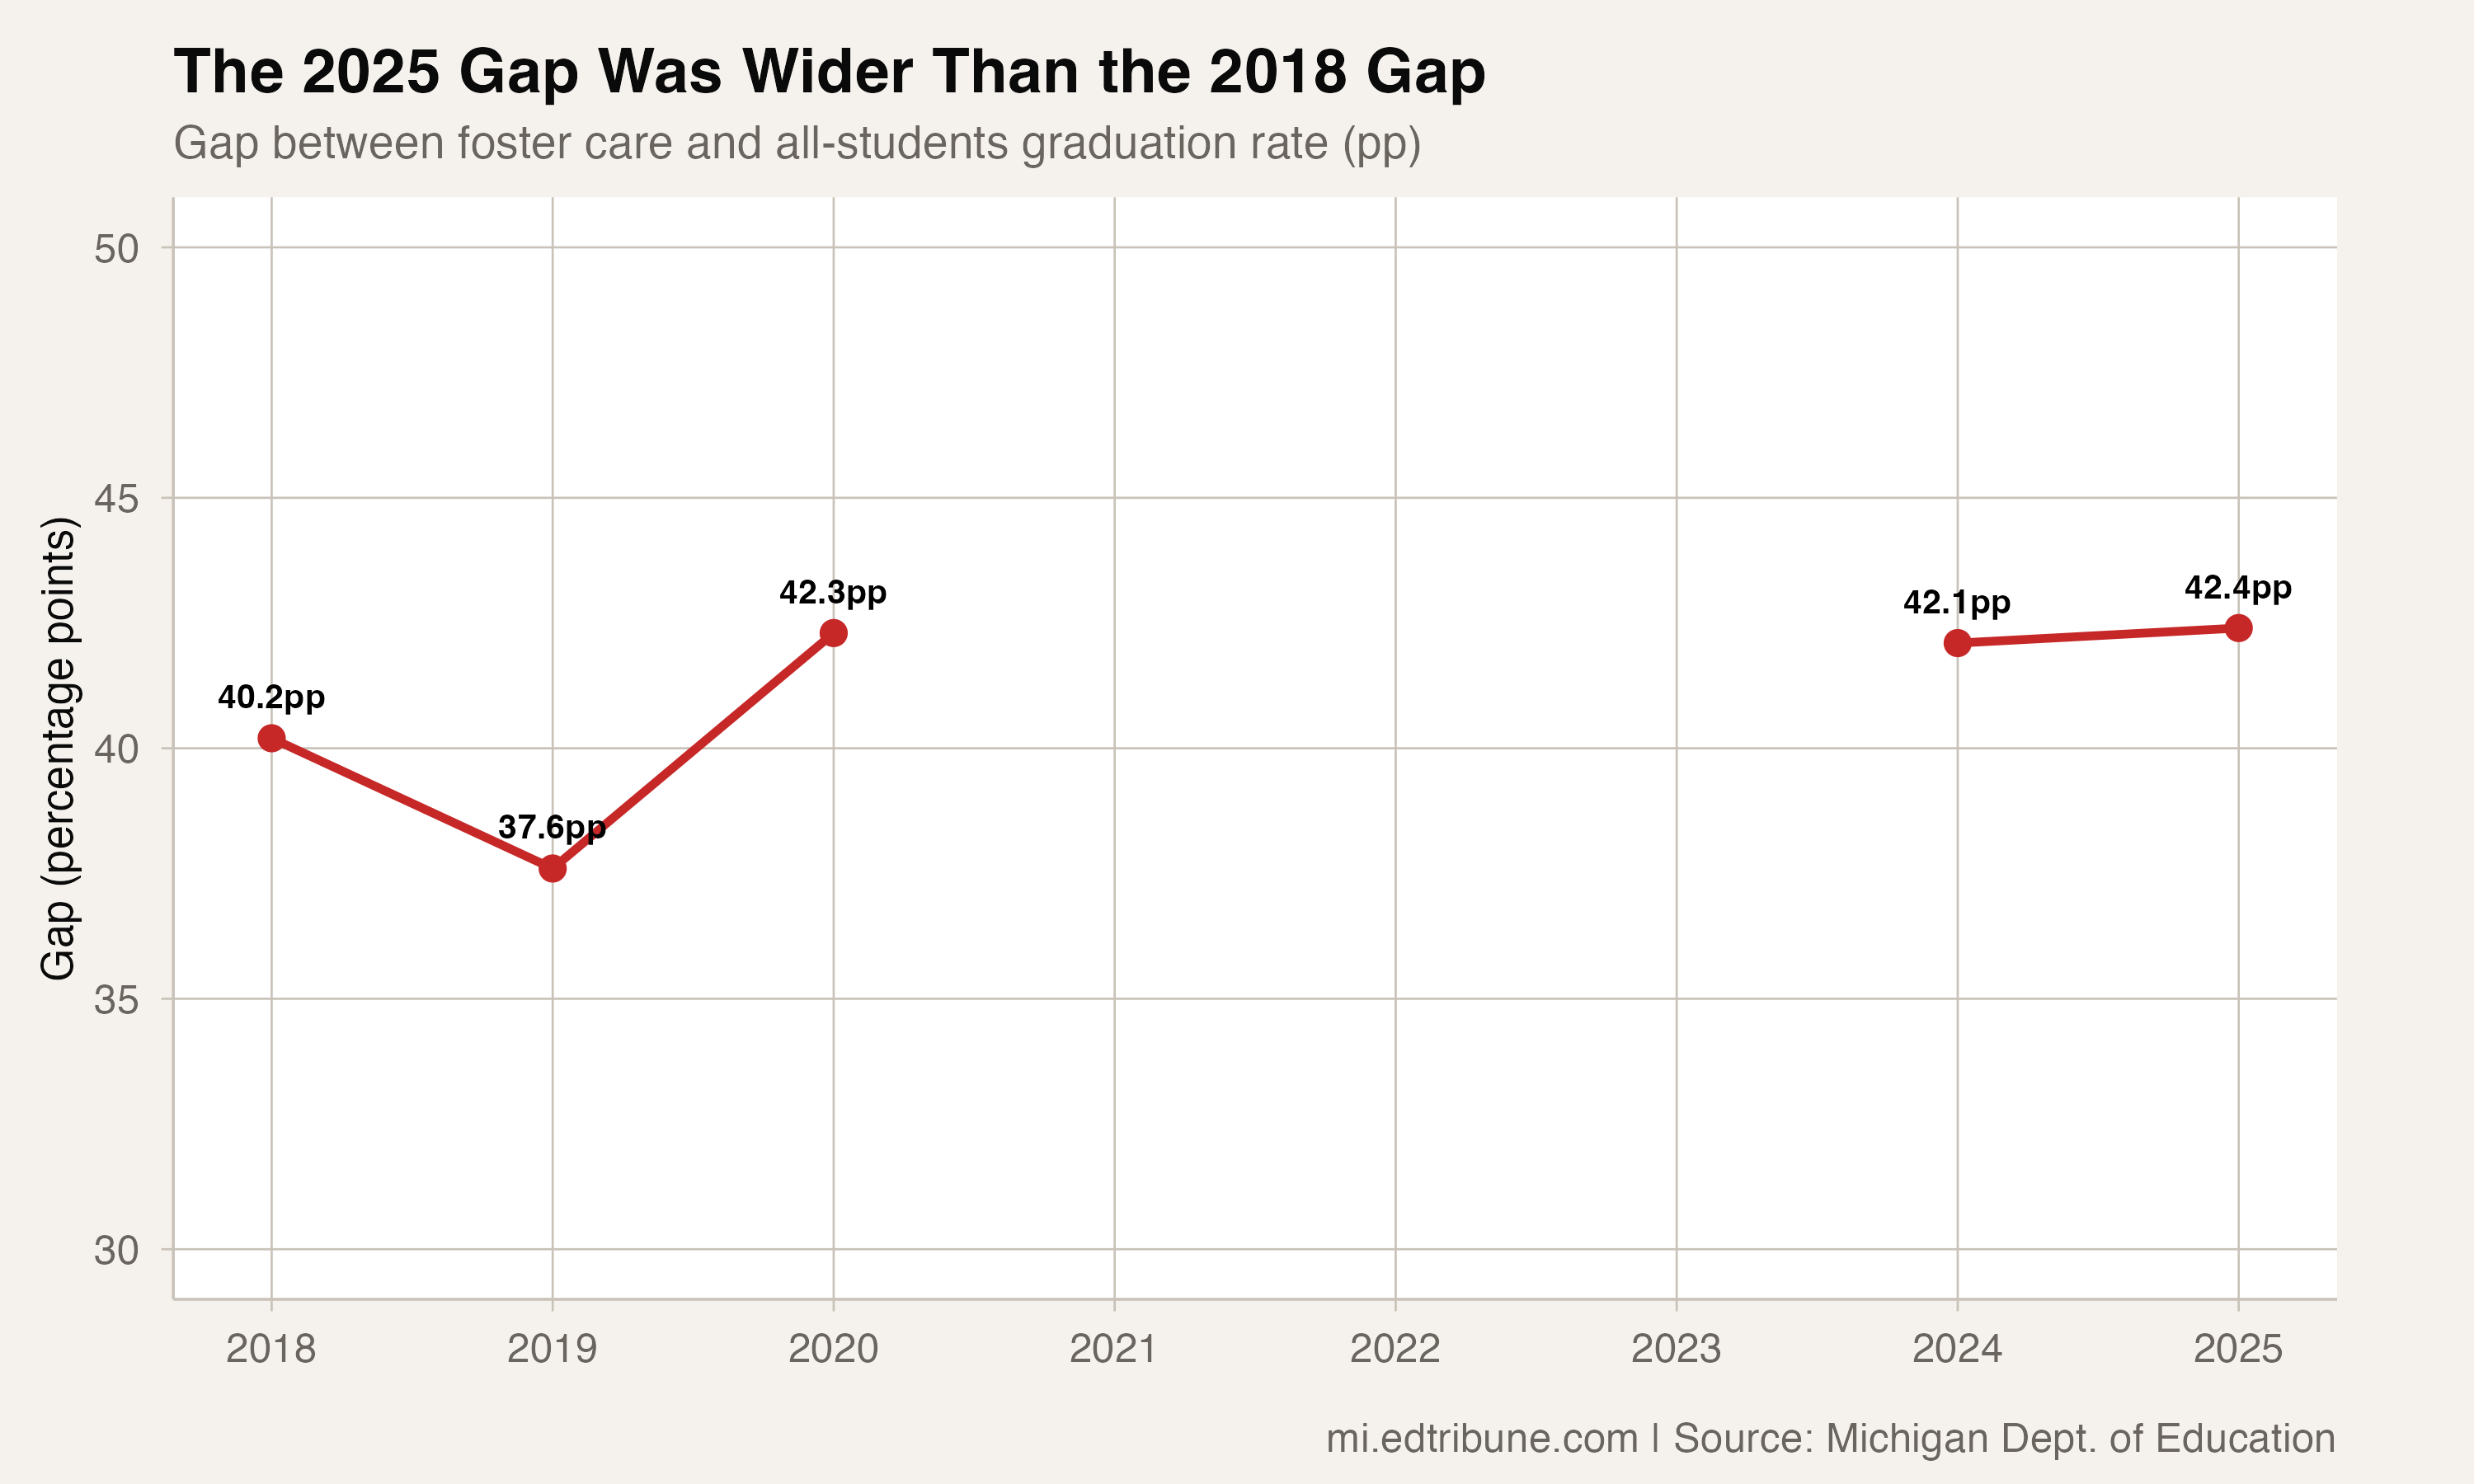
The all-students row is available for 2018 through 2020 and again for 2024 and 2025. It is missing for 2021 through 2023, even though the foster-care rows are present. That means the statewide gap can be compared only in the five years when both rows exist.
The gap was 40.2 points in 2018, 37.6 points in 2019 and 42.3 points in 2020. It measured 42.1 points in 2024 and 42.4 points in 2025. Those values show that the endpoint gap was wider than in 2018, but they do not show a continuously widening line.
Other statewide groups improved more at the endpoints
From 2018 to 2025, the rate for students who are economically disadvantaged rose 4.7 points. The rate for students who are currently homeless rose 7.2 points, and the rate for students with disabilities rose 4.7 points. Each exceeded the 1.2-point gain for students in foster care.
The published foster-care cohort declined from 626 students in 2018 to 524 in 2025, a 16% decrease. The graduation data do not establish why the cohort changed or why the foster-care rate moved less than the comparison rates. Those mechanisms remain unresourced.
Detailed code that reproduces the analysis and figures in this article is available exclusively to EdTribune subscribers.
Discussion
Sign in to join the discussion.
Loading comments...