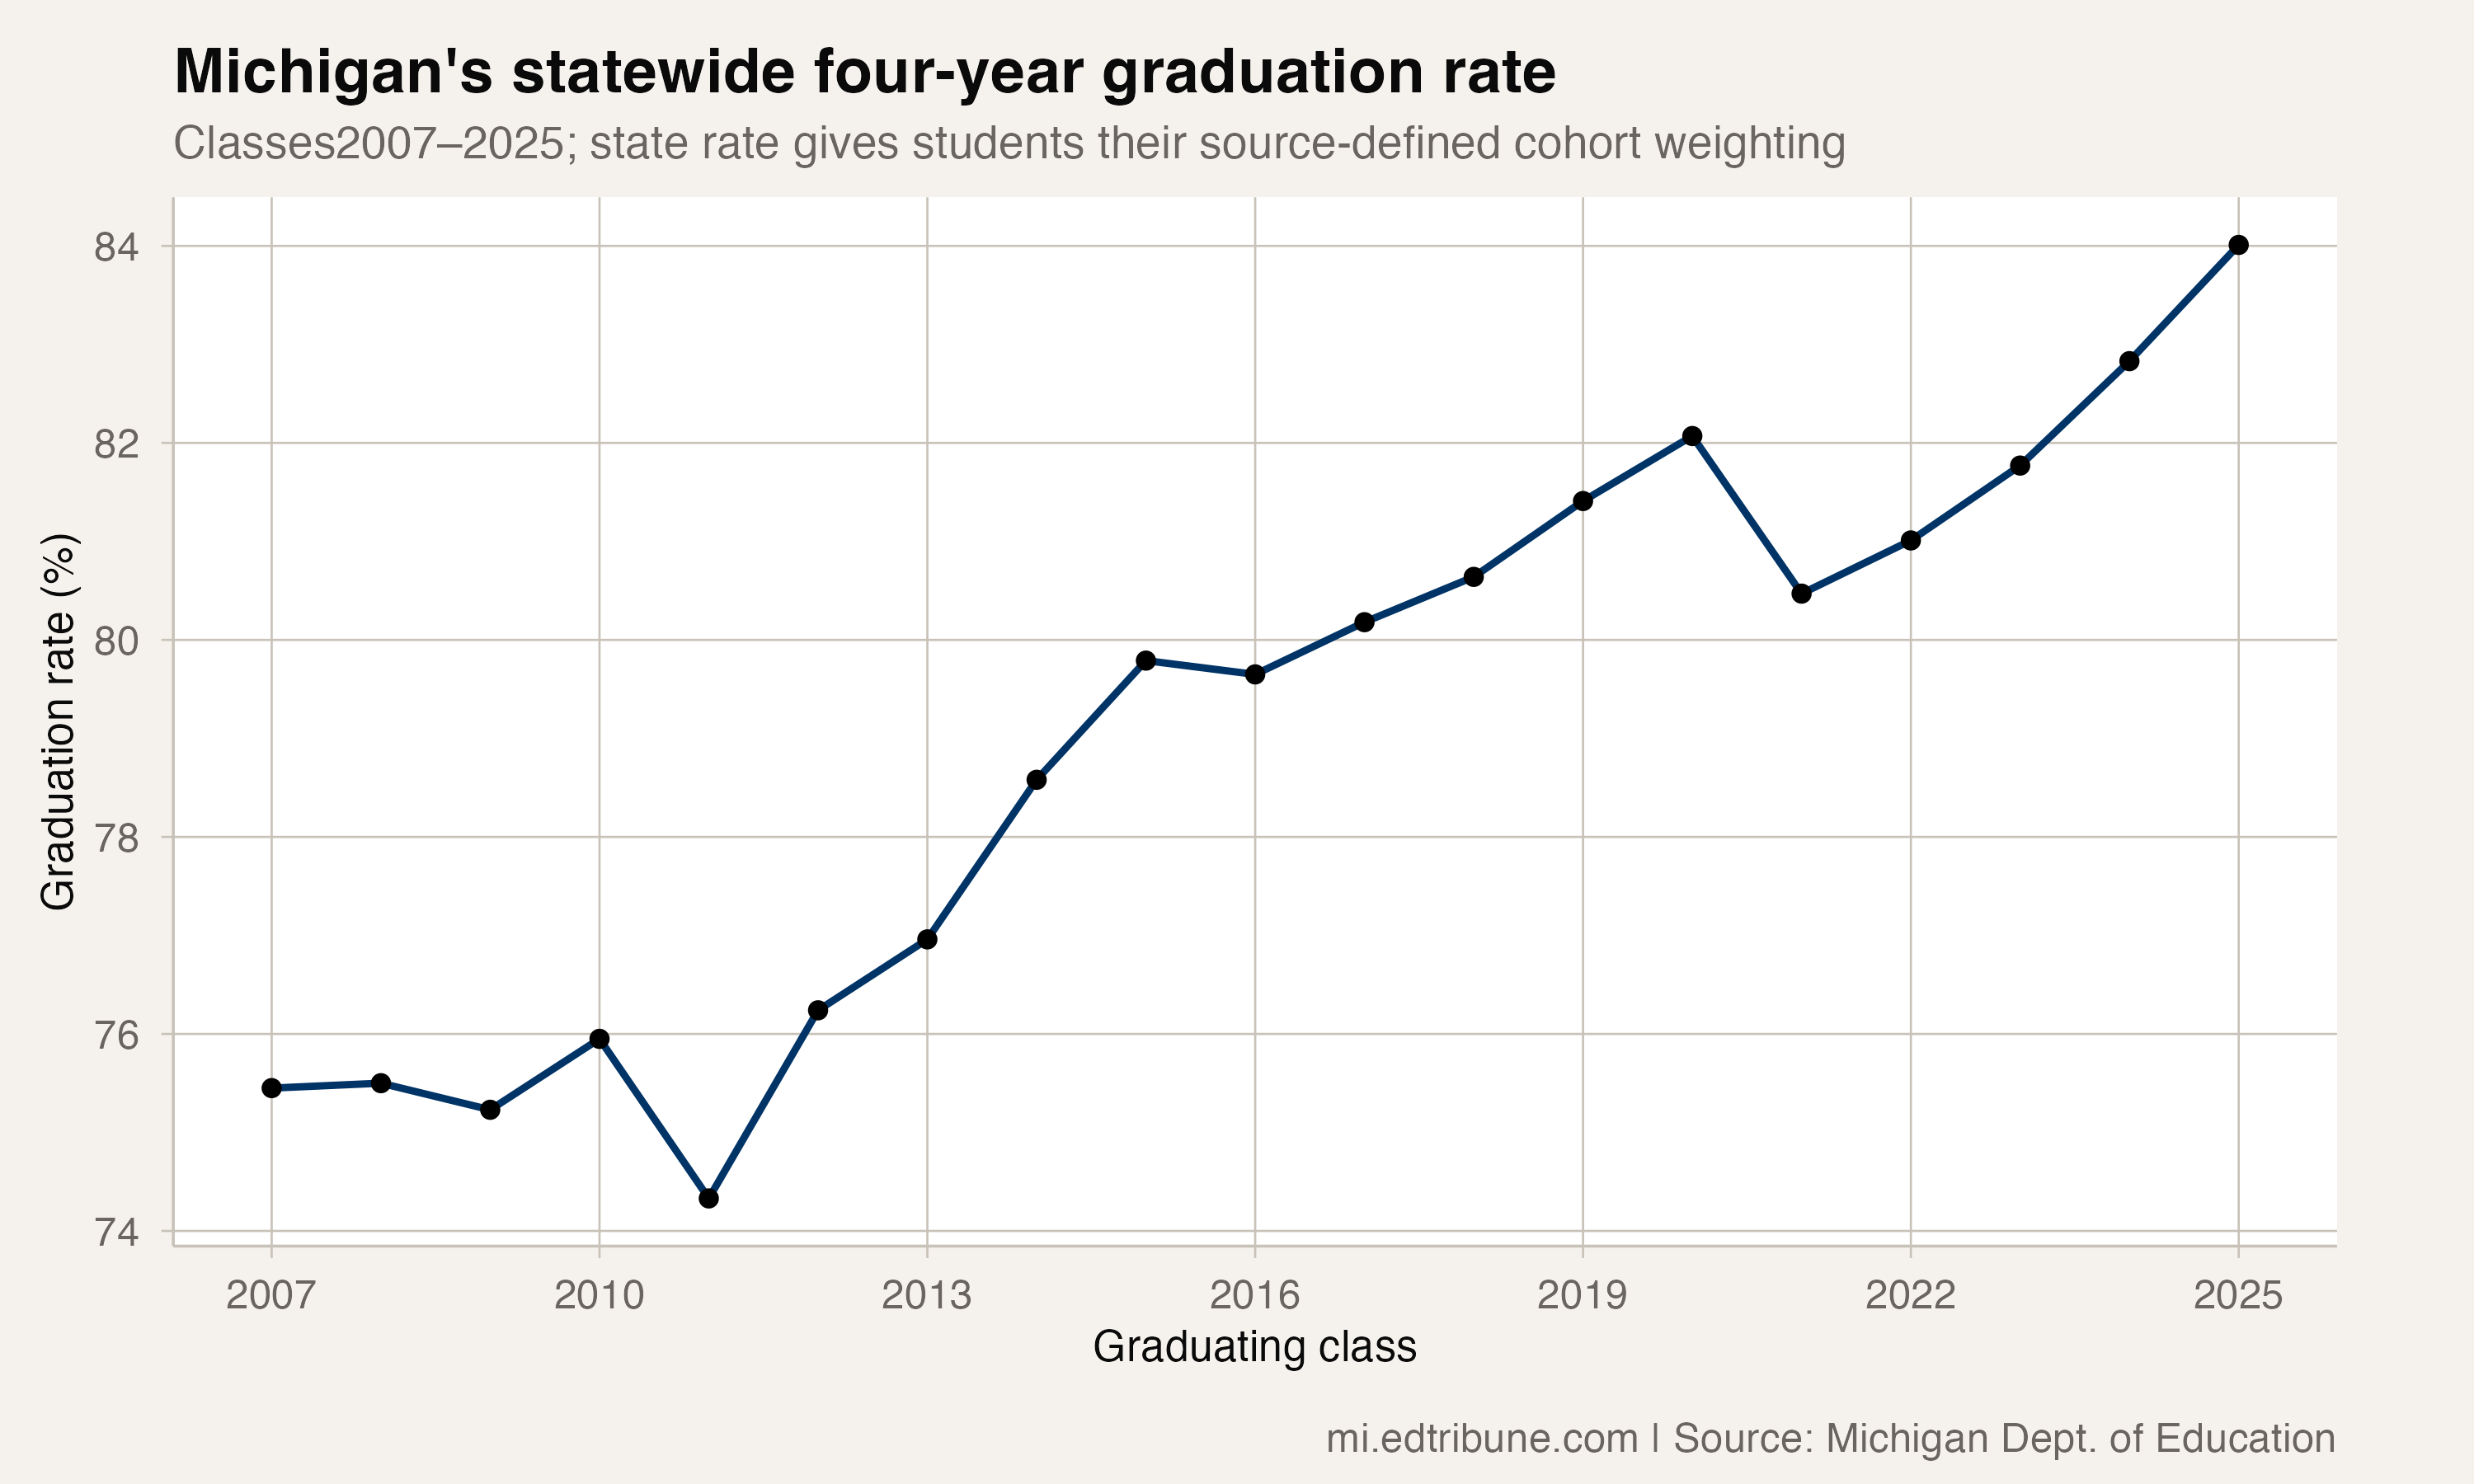
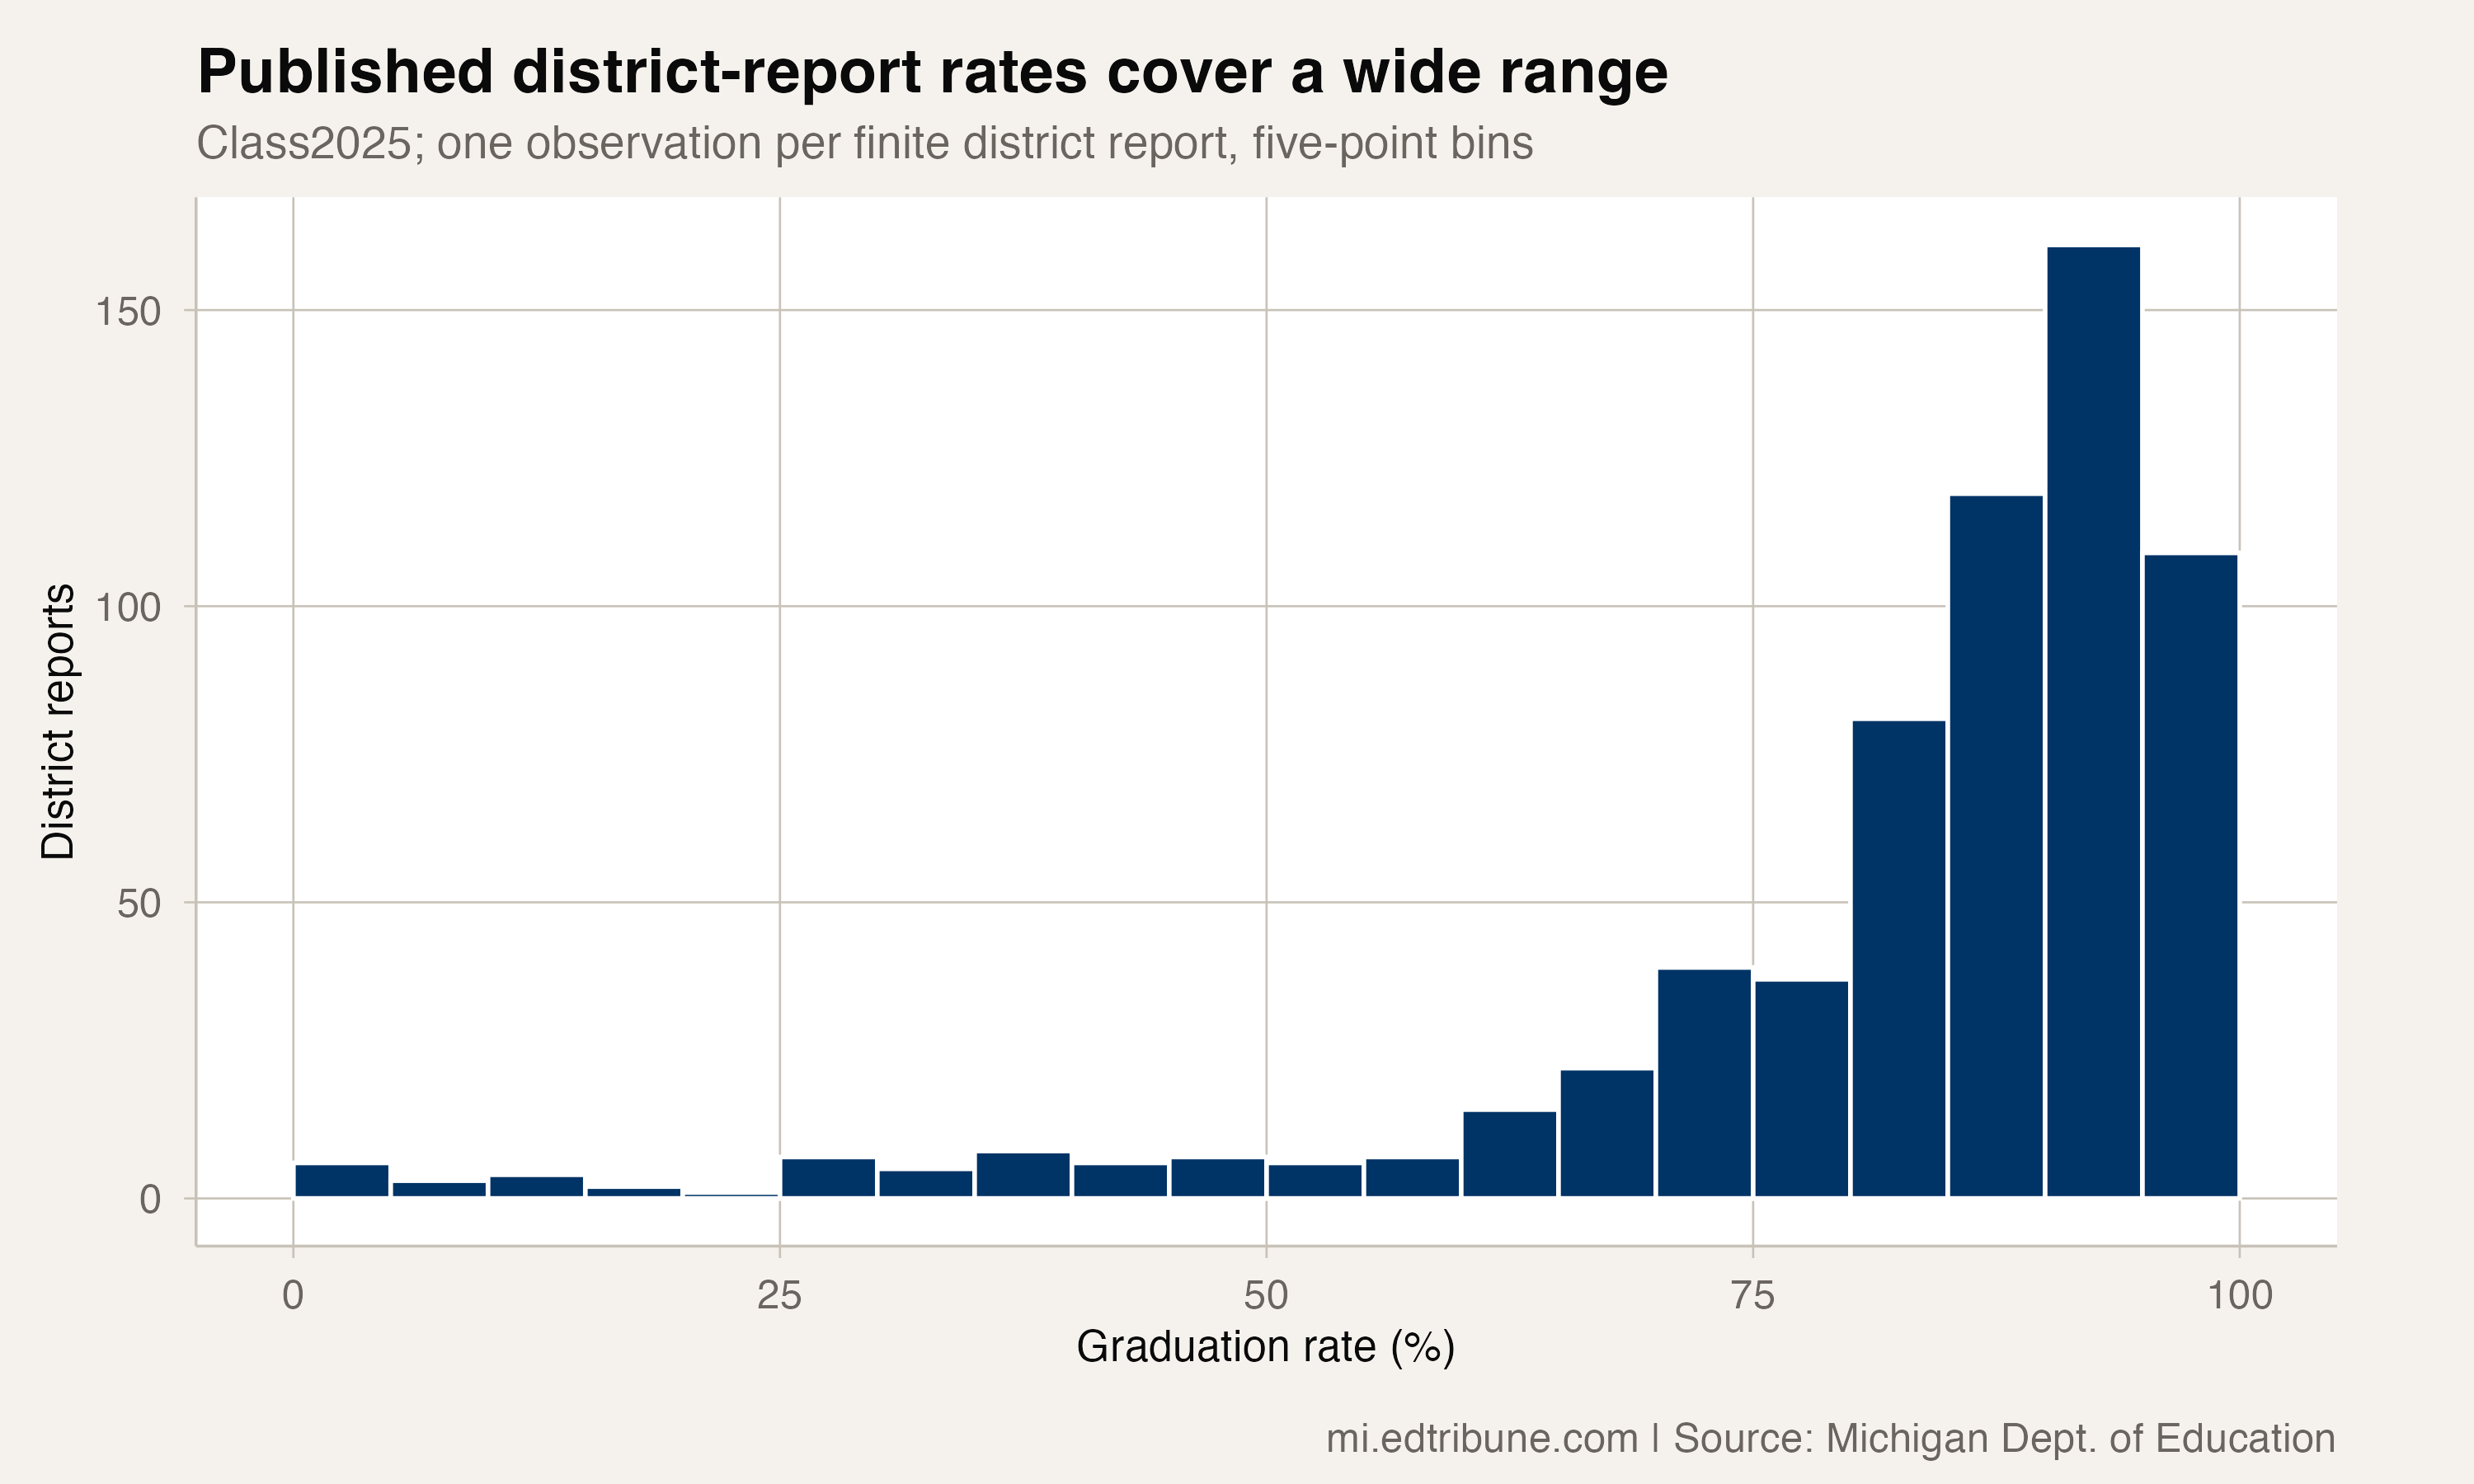
Michigan's four-year graduation rate reached 84.0% for the Class of 2025, the highest statewide rate in the available reporting panel from 2007 through 2025. The statewide improvement sits alongside a broad range of district-level outcomes. Among 645 district reports with a published rate, 110 reached at least 95%, while 97 were below 70%.
Those counts describe reports, rather than the share of Michigan students in each group. Each district report gets one observation in this comparison, while the published statewide rate measures the state's graduating cohort. A distribution of district rates cannot replace that statewide measure.
The statewide result and local outcomes answer different questions
The state's rate rose from 82.8% for the Class of 2024 to 84.0% for the Class of 2025, an increase of 1.2 percentage points. The earliest statewide observation in this panel, for the Class of 2007, was 75.5%. The historical comparison is limited to the available panel; it does not establish an all-time record before that window.
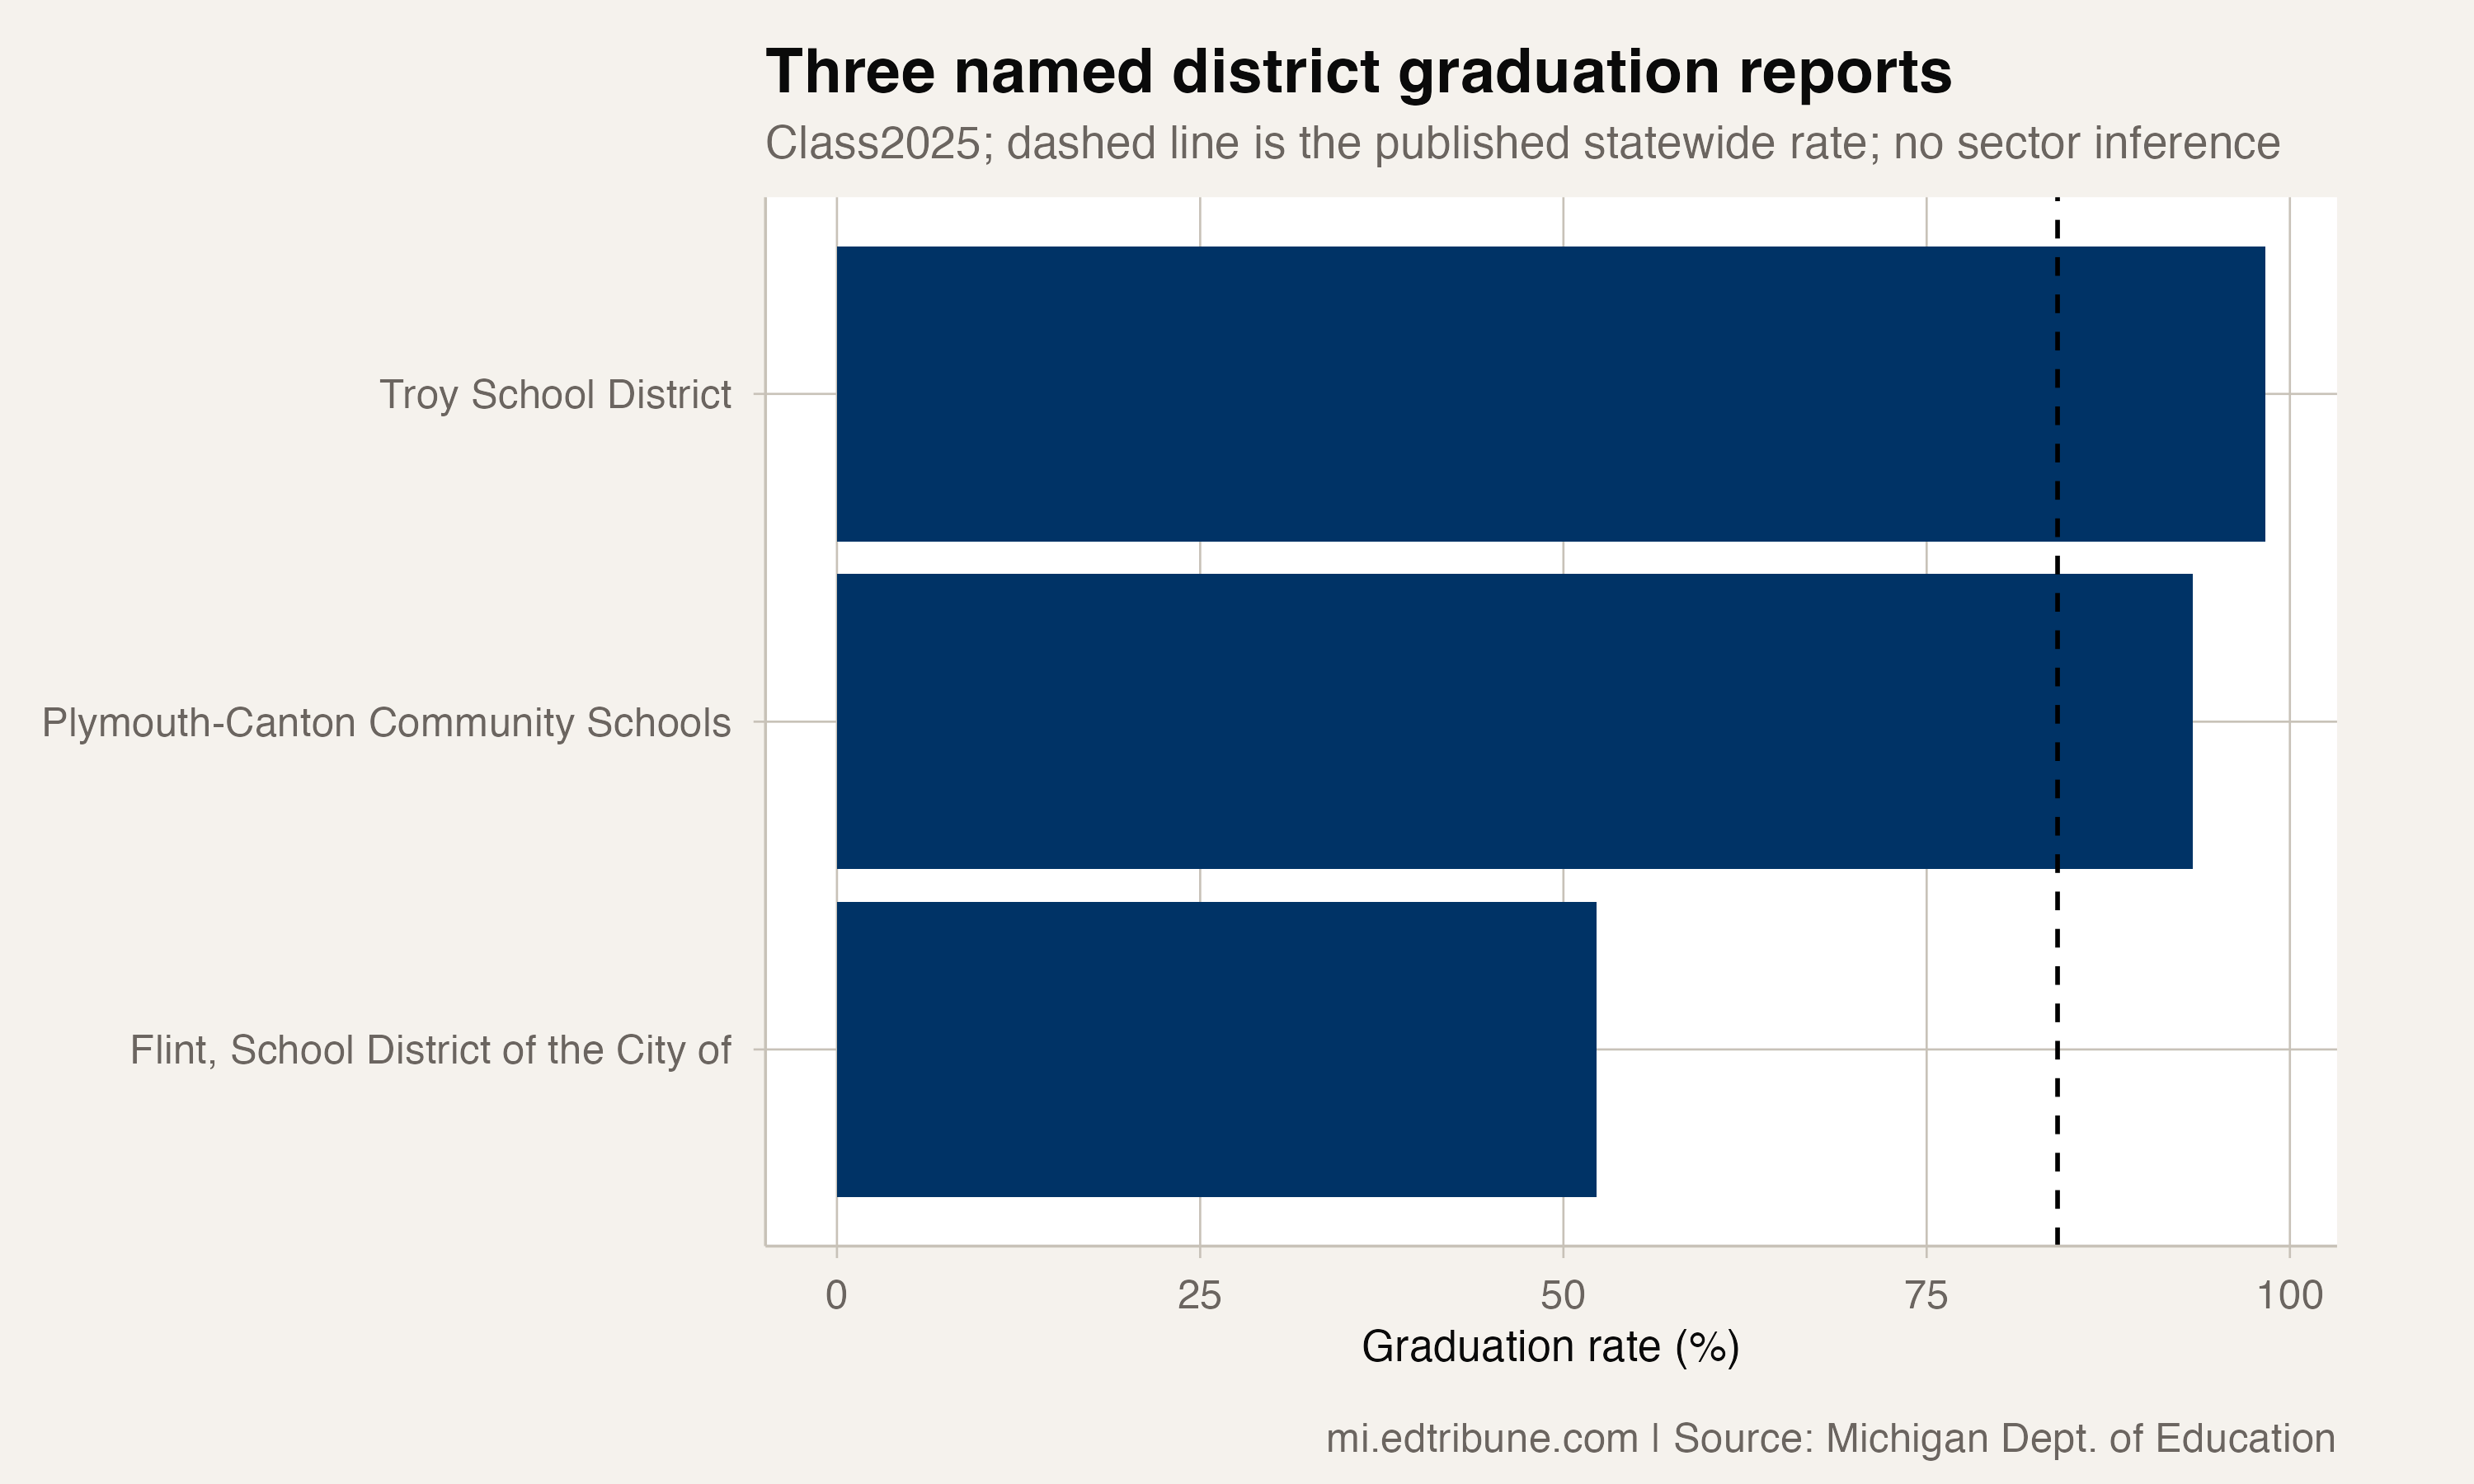
Named district reports show how different an outcome can look within the statewide result. Troy School District↗ET reported 98.3% for the Class of 2025. Plymouth-Canton Community Schools↗ET reported 93.3%, and Flint, School District of the City of↗ET reported 52.3%.
These are separate cohort rates, not a comparison of individual students' chances after accounting for their circumstances. The figures do not establish why a district's rate differs from the state or how a particular program affected it.
Threshold counts need precise language
The high-rate count uses “at least 95%,” including a report at exactly that boundary. If the comparison instead uses “above 95%,” the count is 109. That distinction is small in size but necessary for stating what the published reports support.
At the other end, the 97 reports below 70% are defined by a strict cutoff. These thresholds were chosen to describe the distribution. They are not evidence that Michigan has two distinct education systems, and they do not identify the governance or student populations behind the rates.
The distribution includes every finite published district-level all-students rate in the latest reporting year. Eighteen other district reports lacked a usable published rate and are excluded. Their outcomes are unknown in this comparison, rather than treated as zero or grouped with the low-rate reports.
A wide range is not a cause
The Michigan Center for Educational Performance and Information's graduation reporting supplies published outcomes and cohort definitions. The data used here does not provide the consistent charter, virtual-program or geographic fields needed to explain the distribution by those categories. A name that sounds like an academy or a rural place is not a substitute for such a field.
Nor does a lower four-year graduation rate mean that every other student dropped out. Students can have other recorded outcomes, and this comparison does not assign destinations or subsequent graduation to them.
The statewide high and the local range can both be true. Michigan improved at the statewide level, while some district reports remained well below it. The next reporting task is to understand those named cohort outcomes from local evidence, without converting a threshold or a district name into an explanation.
Detailed code that reproduces the analysis and figures in this article is available exclusively to EdTribune subscribers.
Discussion
Sign in to join the discussion.
Loading comments...