Correction (October 8, 2026): This analysis now uses published statewide totals throughout the complete reporting window. An earlier version described the special education graduation gap as currently widening and as the only subgroup gap that widened across the available series. The article has been rewritten to reflect the complete record.
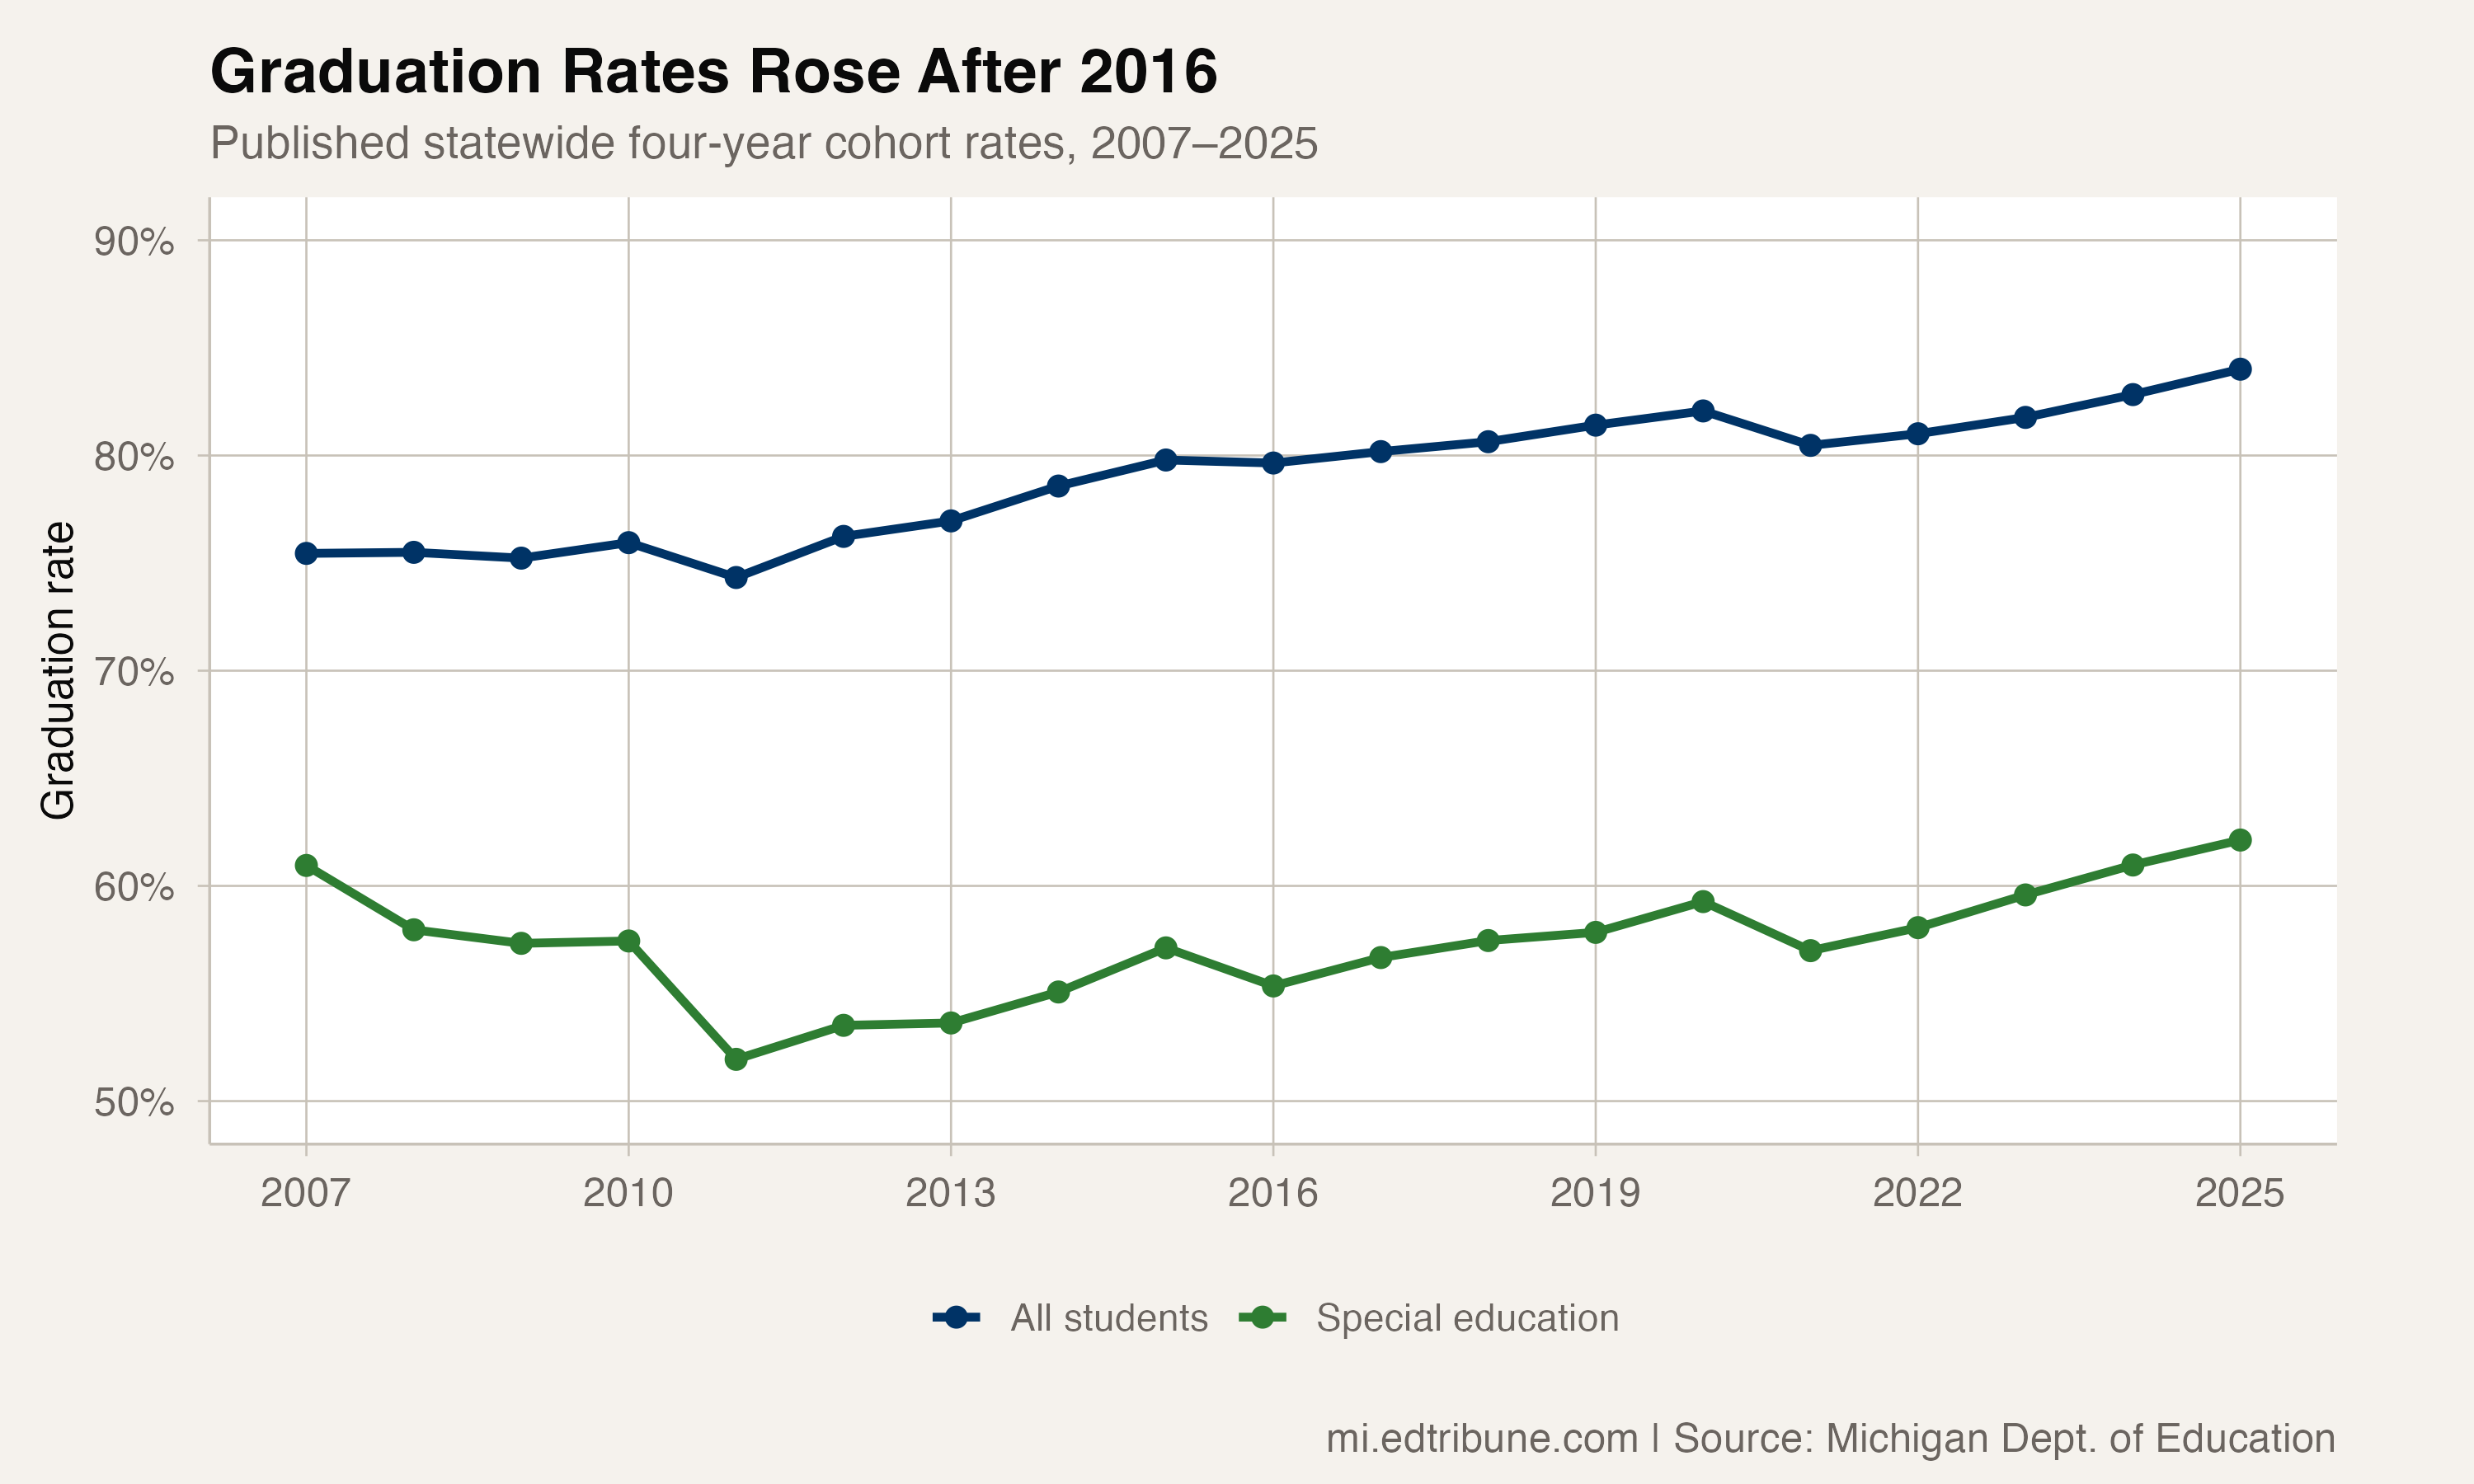
Michigan's four-year graduation rate for students receiving special education services reached 62.1% for the 2025 cohort, the most recent published cohort in the records used here. That was the highest rate in the state's 19-year record, covering 2007 through 2025.
The recent direction is encouraging. The rate has risen in four consecutive annual transitions across the five reporting years from 2021 through 2025, when it stood at 57.0%. It reached 58.1% in 2022, 59.6% in 2023 and 61.0% in 2024 before gaining again in 2025.
A recovery that began from a deep gap
The longer record is less comfortable. The special education graduation rate was 61.0% in 2007, then fell to a panel low of 51.9% in 2011. By 2016 it had recovered to 55.4%, while Michigan's all-students rate had reached 79.7%.
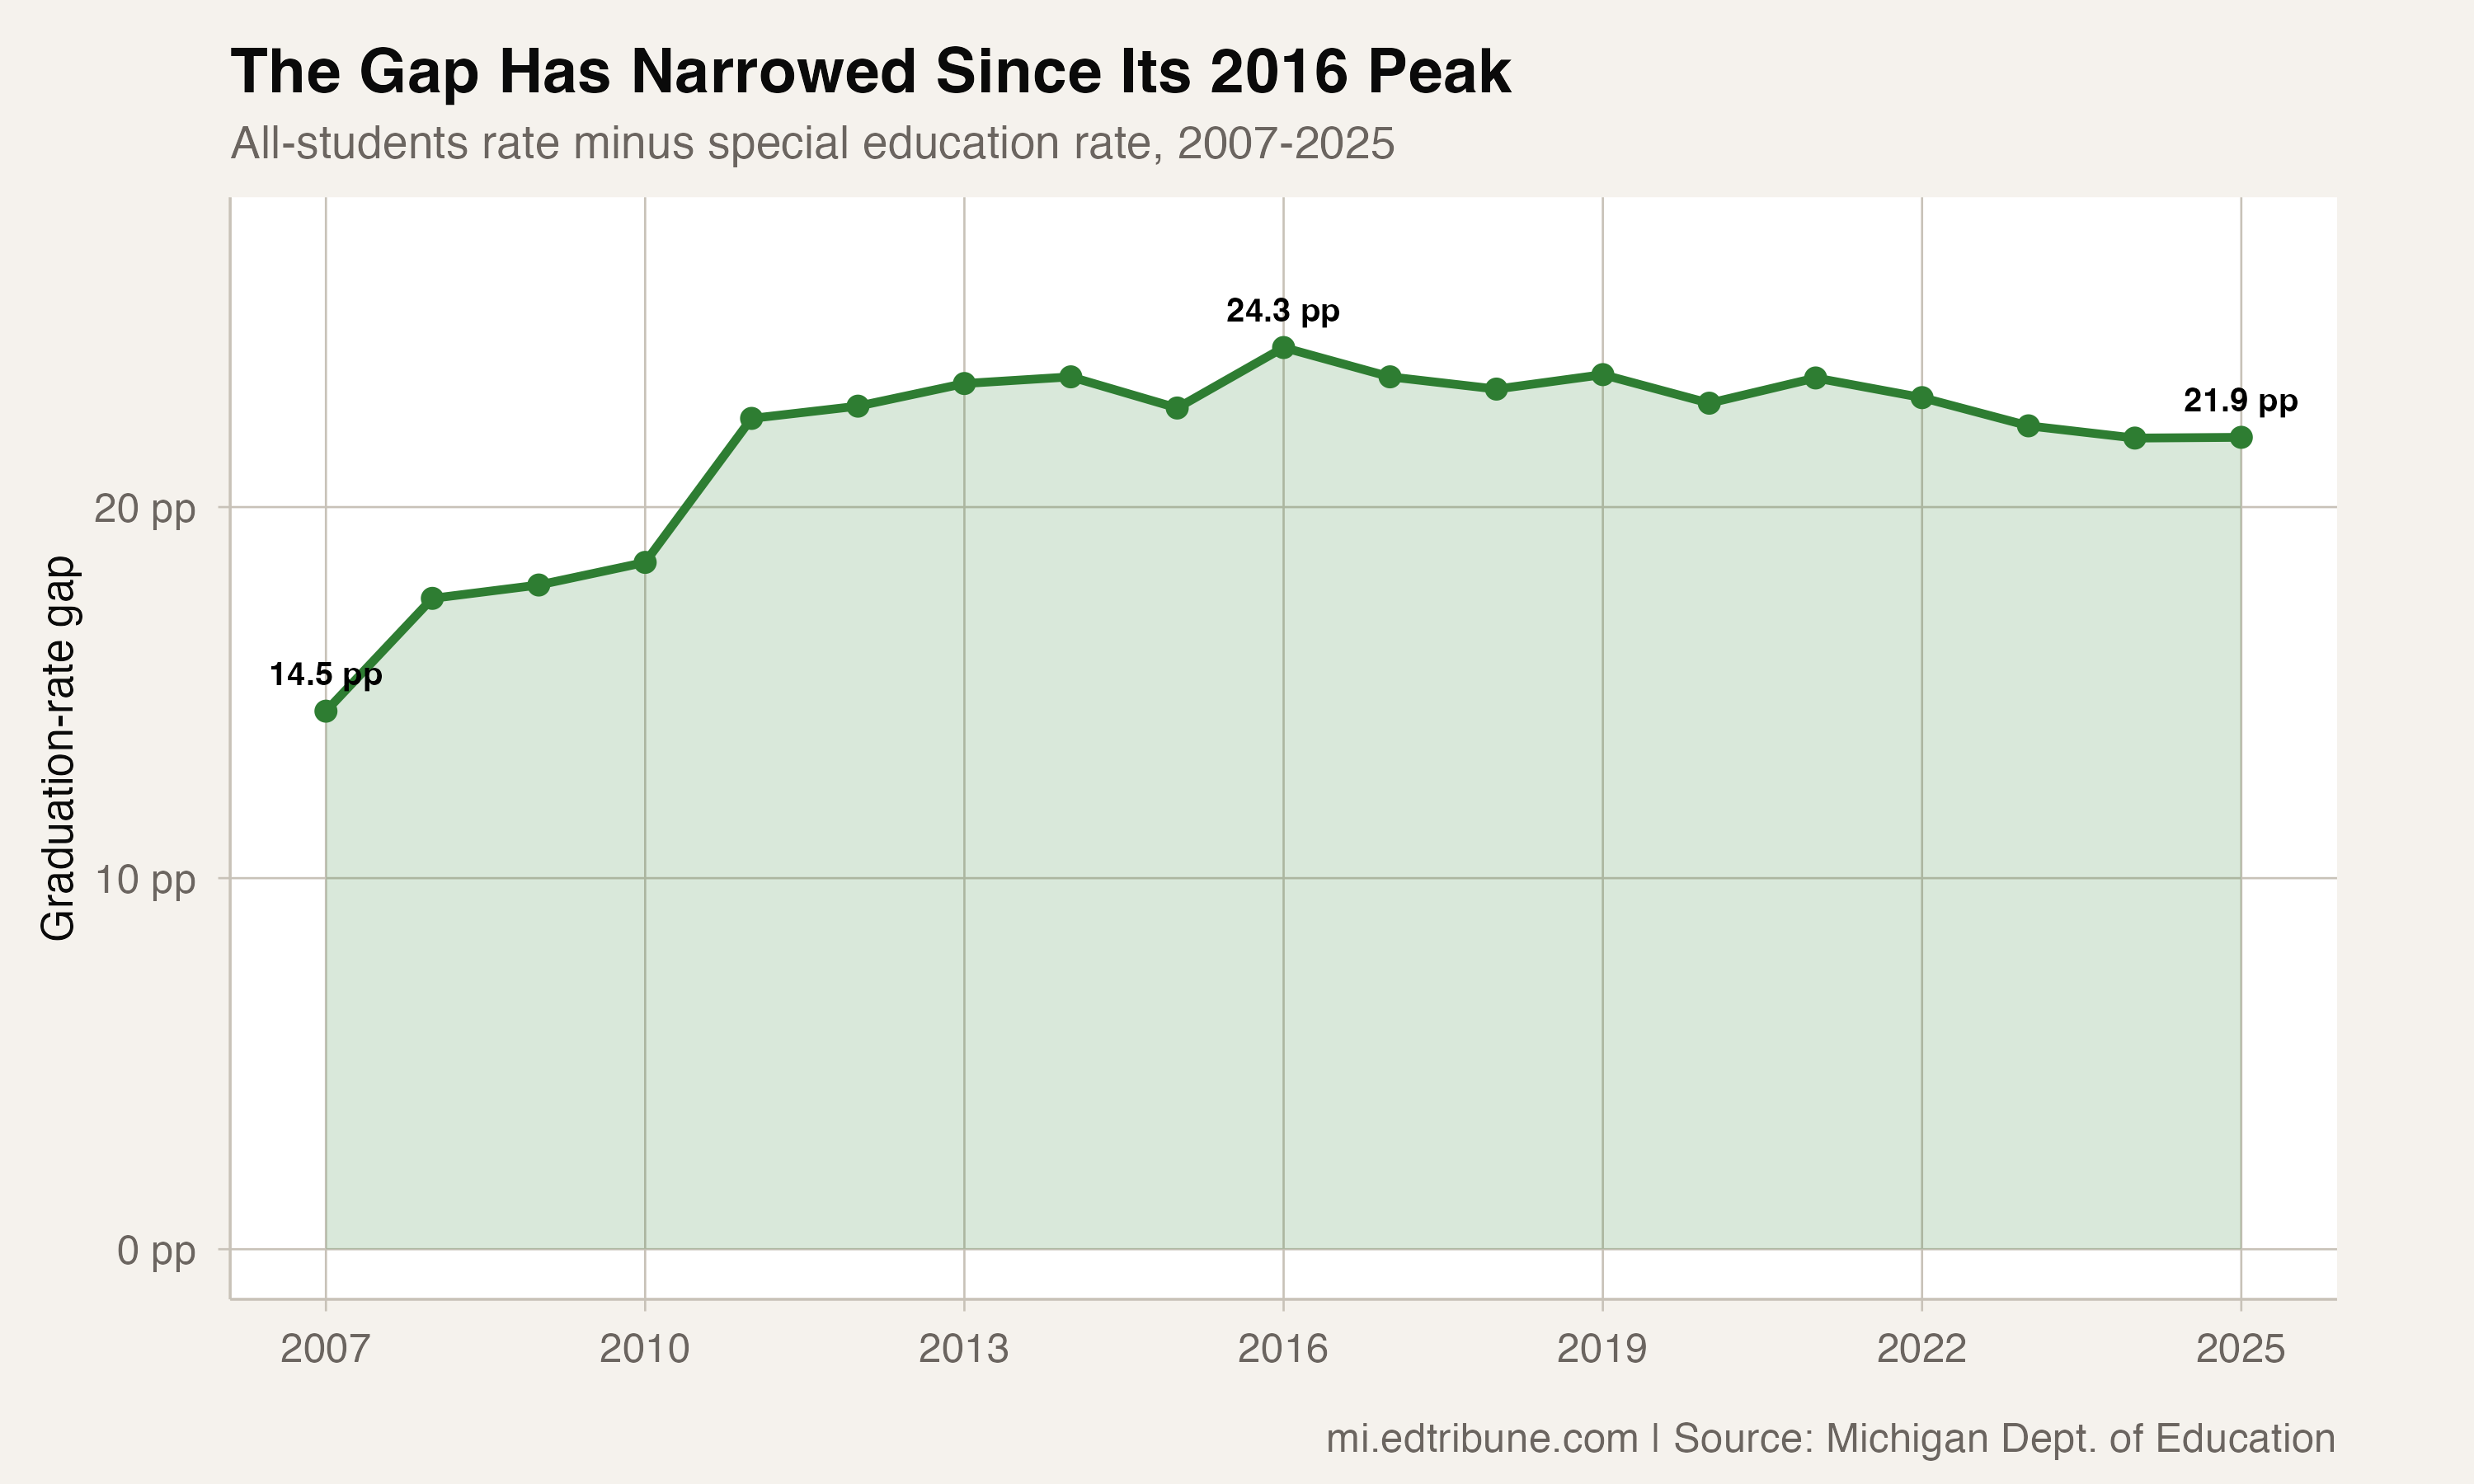
From that point, the rate for students receiving special education services rose 6.8 percentage points through 2025. The all-students rate rose 4.4 points over the same period, to 84.0%. Because the special education rate improved faster, the gap between the two narrowed from 24.3 points in 2016 to 21.9 points in 2025.
That 2.4-point narrowing corrects the direction implied by an earlier version of this article. It also needs the older baseline beside it. The gap was 14.5 points in 2007, so the 2025 gap remained 7.4 points wider than at the start of the record even after improving from its 2016 peak.
Progress shared across several groups
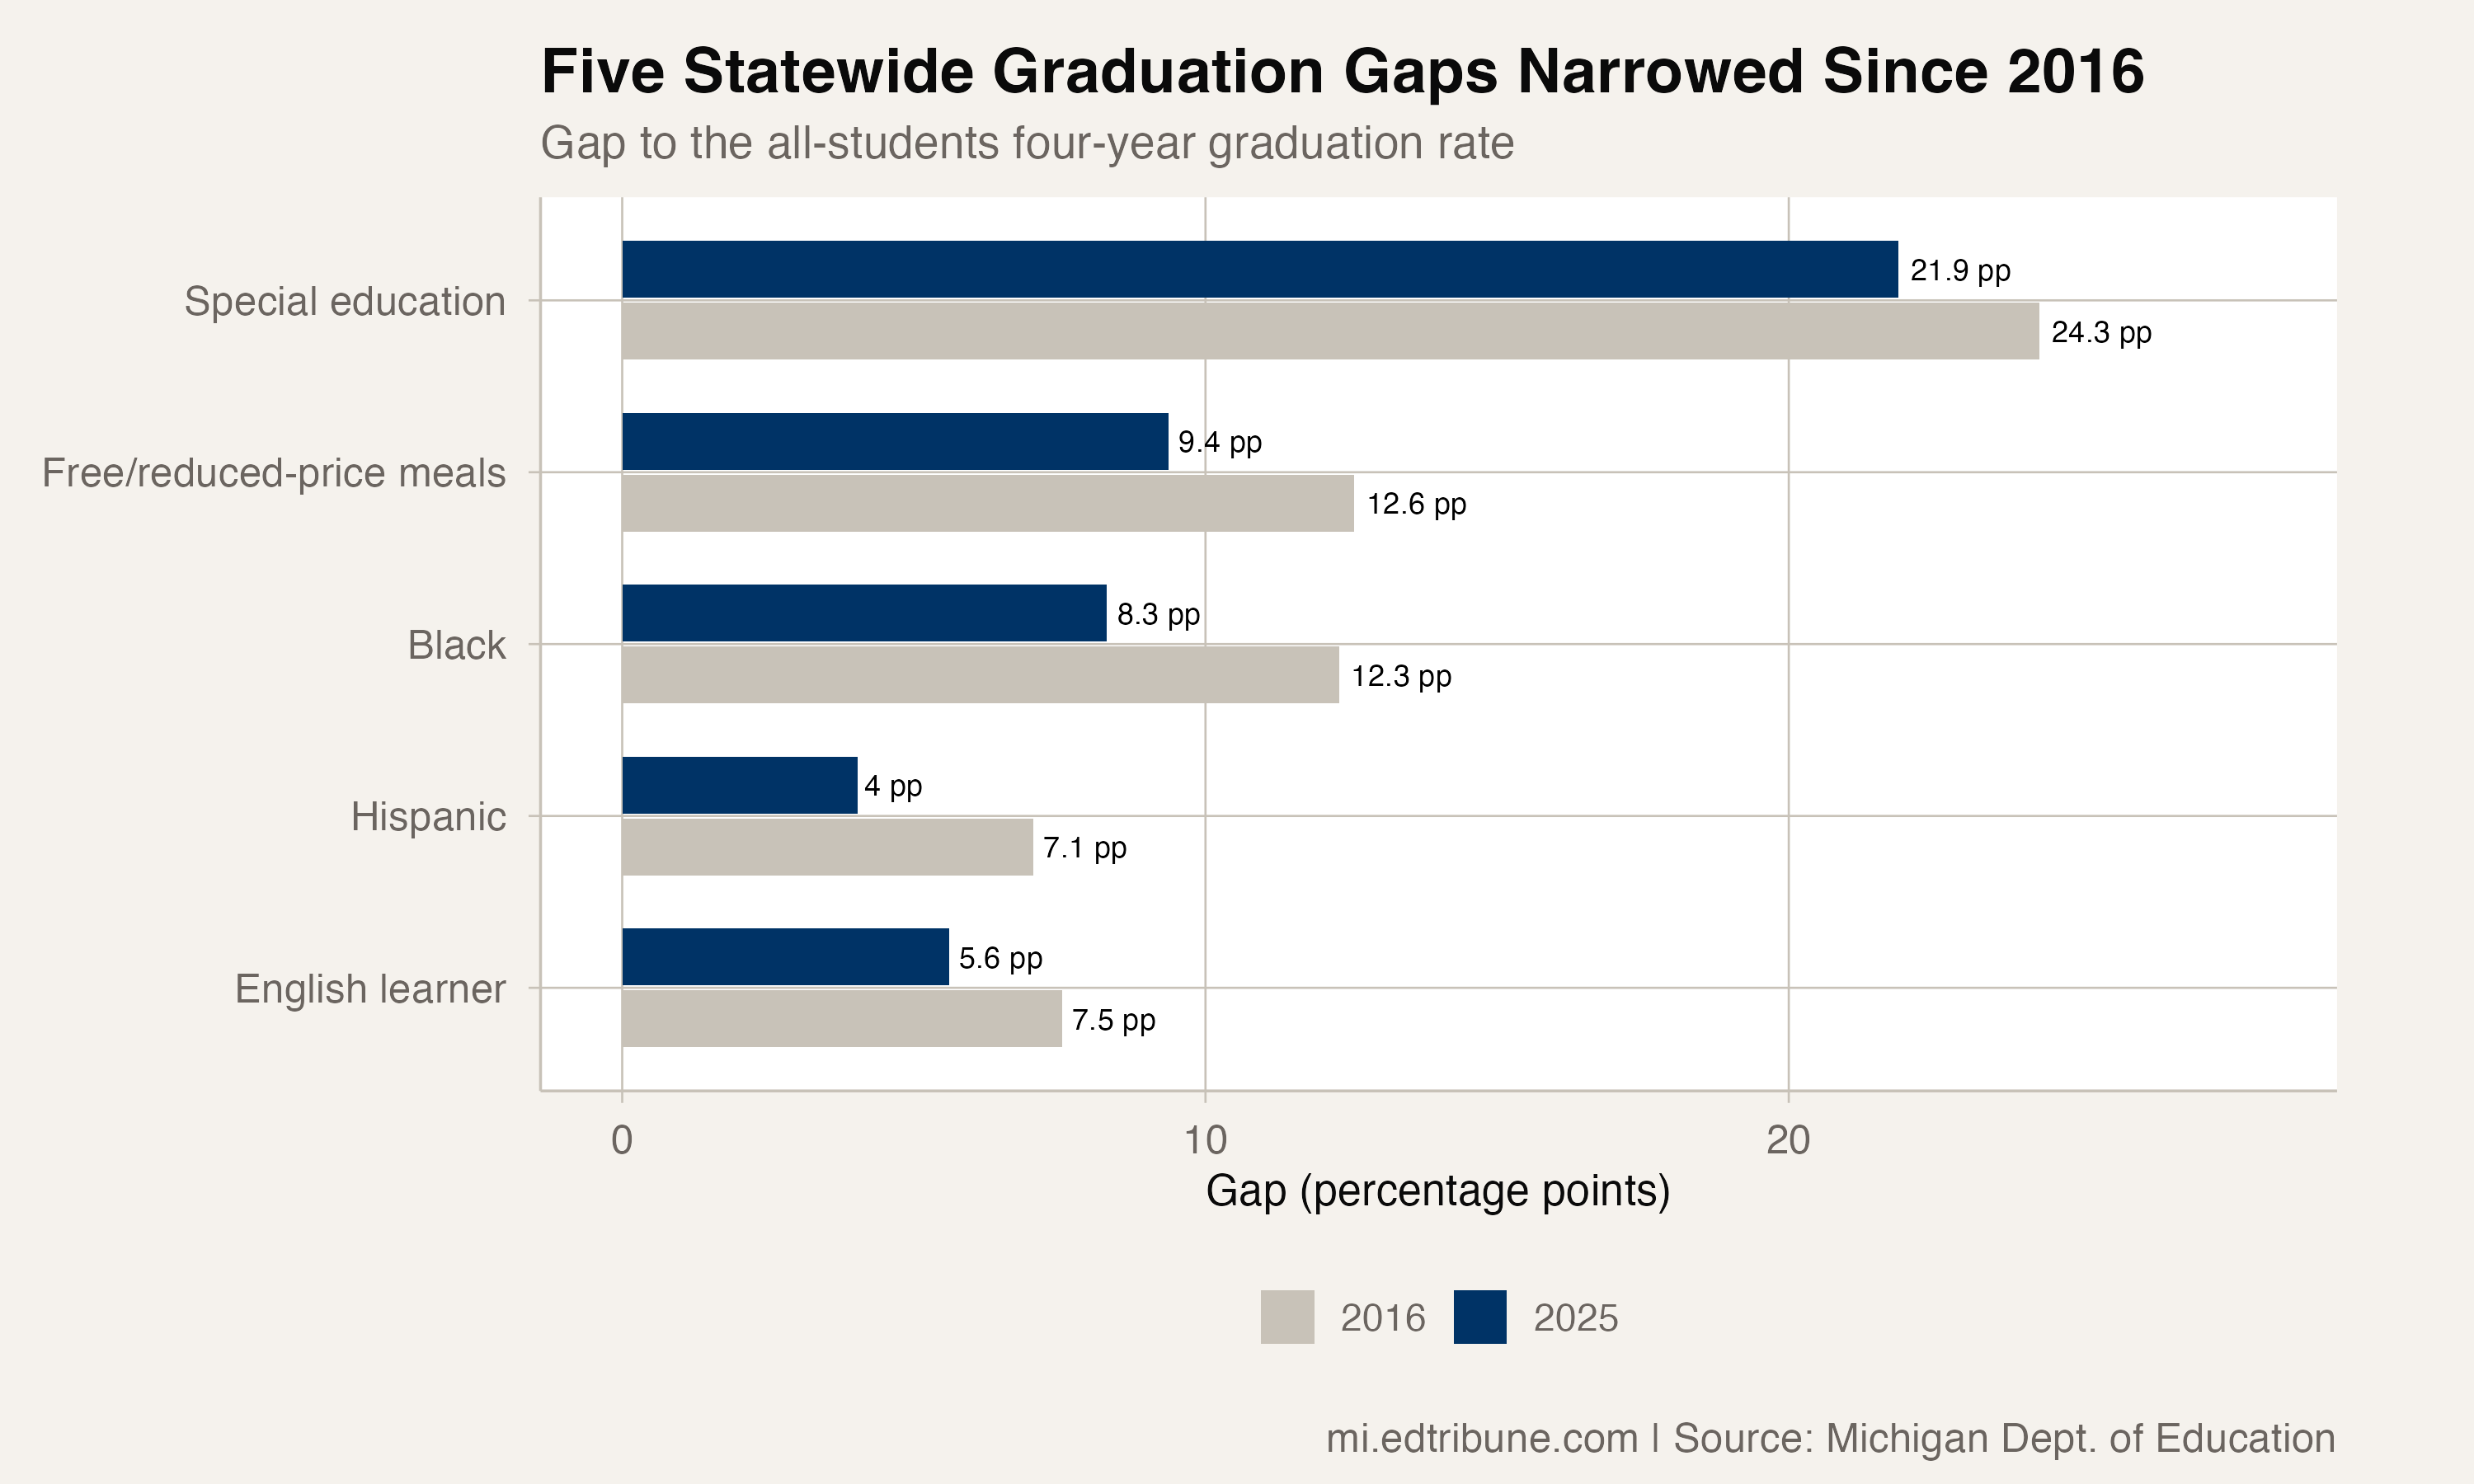
Special education was not alone in improving after 2016. Gaps to the statewide rate also narrowed by 2025 for Black students, Hispanic students, English learners and students eligible for free or reduced-price meals. The comparison does not treat those categories as pieces of a single whole: service groups can overlap with racial and ethnic groups.
The special education gap nevertheless remained substantial. In 2025, the statewide rate for students receiving special education services was 62.1%, compared with 84.0% for all students. Graduation records show the size and direction of that difference. They do not identify why the gap persisted or which programs produced the recent improvement.
The students behind the rate
The 2025 special education four-year cohort included 14,020 students, of whom 8,711 earned diplomas counted in the rate. The cohort represented 12.1% of Michigan's published all-students cohort of 115,489. That is a cohort share, not a share of graduates and not an estimate of all K-12 students with disabilities.
The 2025 rate was 10.2 points above the 2011 low. That rebound and the narrower gap since 2016 show progress. The remaining 21.9-point difference is the unfinished part of the record.
Data source: Michigan Center for Educational Performance and Information graduation data.
Detailed code that reproduces the analysis and figures in this article is available exclusively to EdTribune subscribers.
Discussion
Sign in to join the discussion.
Loading comments...