Correction: This article was rebuilt before publication to restore omitted reporting years, correct cohort arithmetic, and remove unsupported explanations.
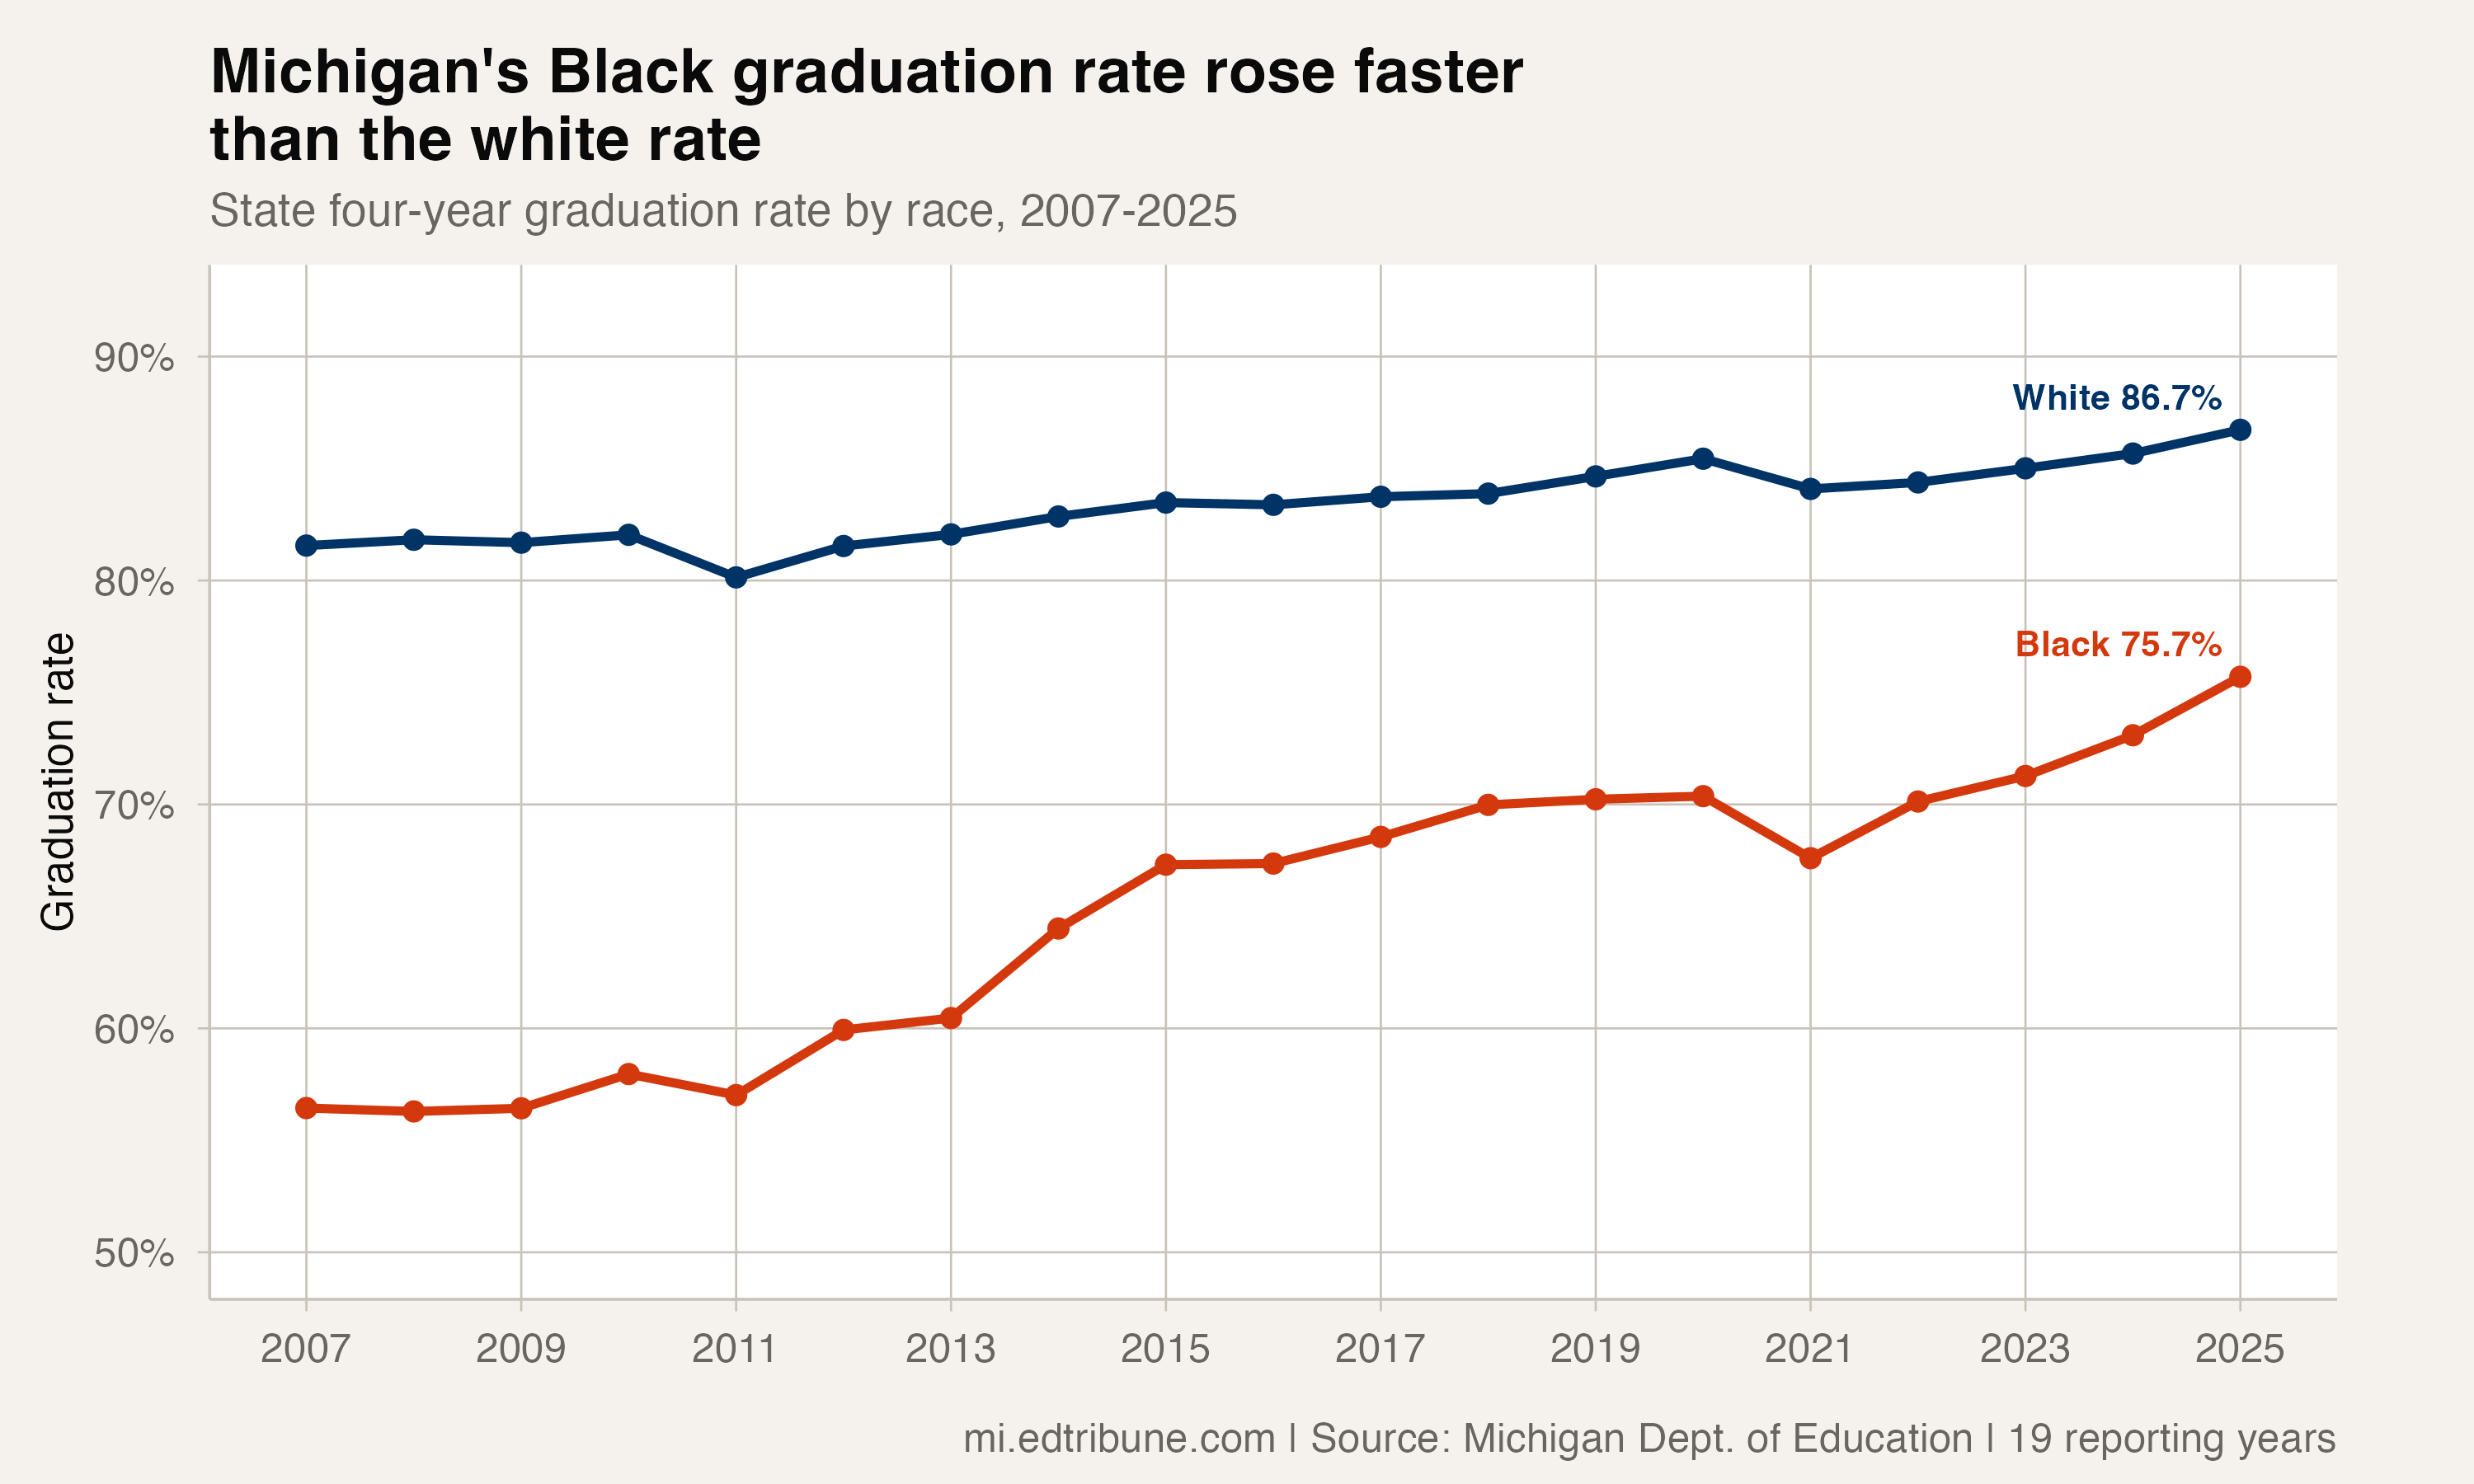
Michigan's four-year graduation rate for Black students rose from 56.4% in 2007 to 75.7% in 2025. Over the same period, the rate for white students rose from 81.6% to 86.7%.
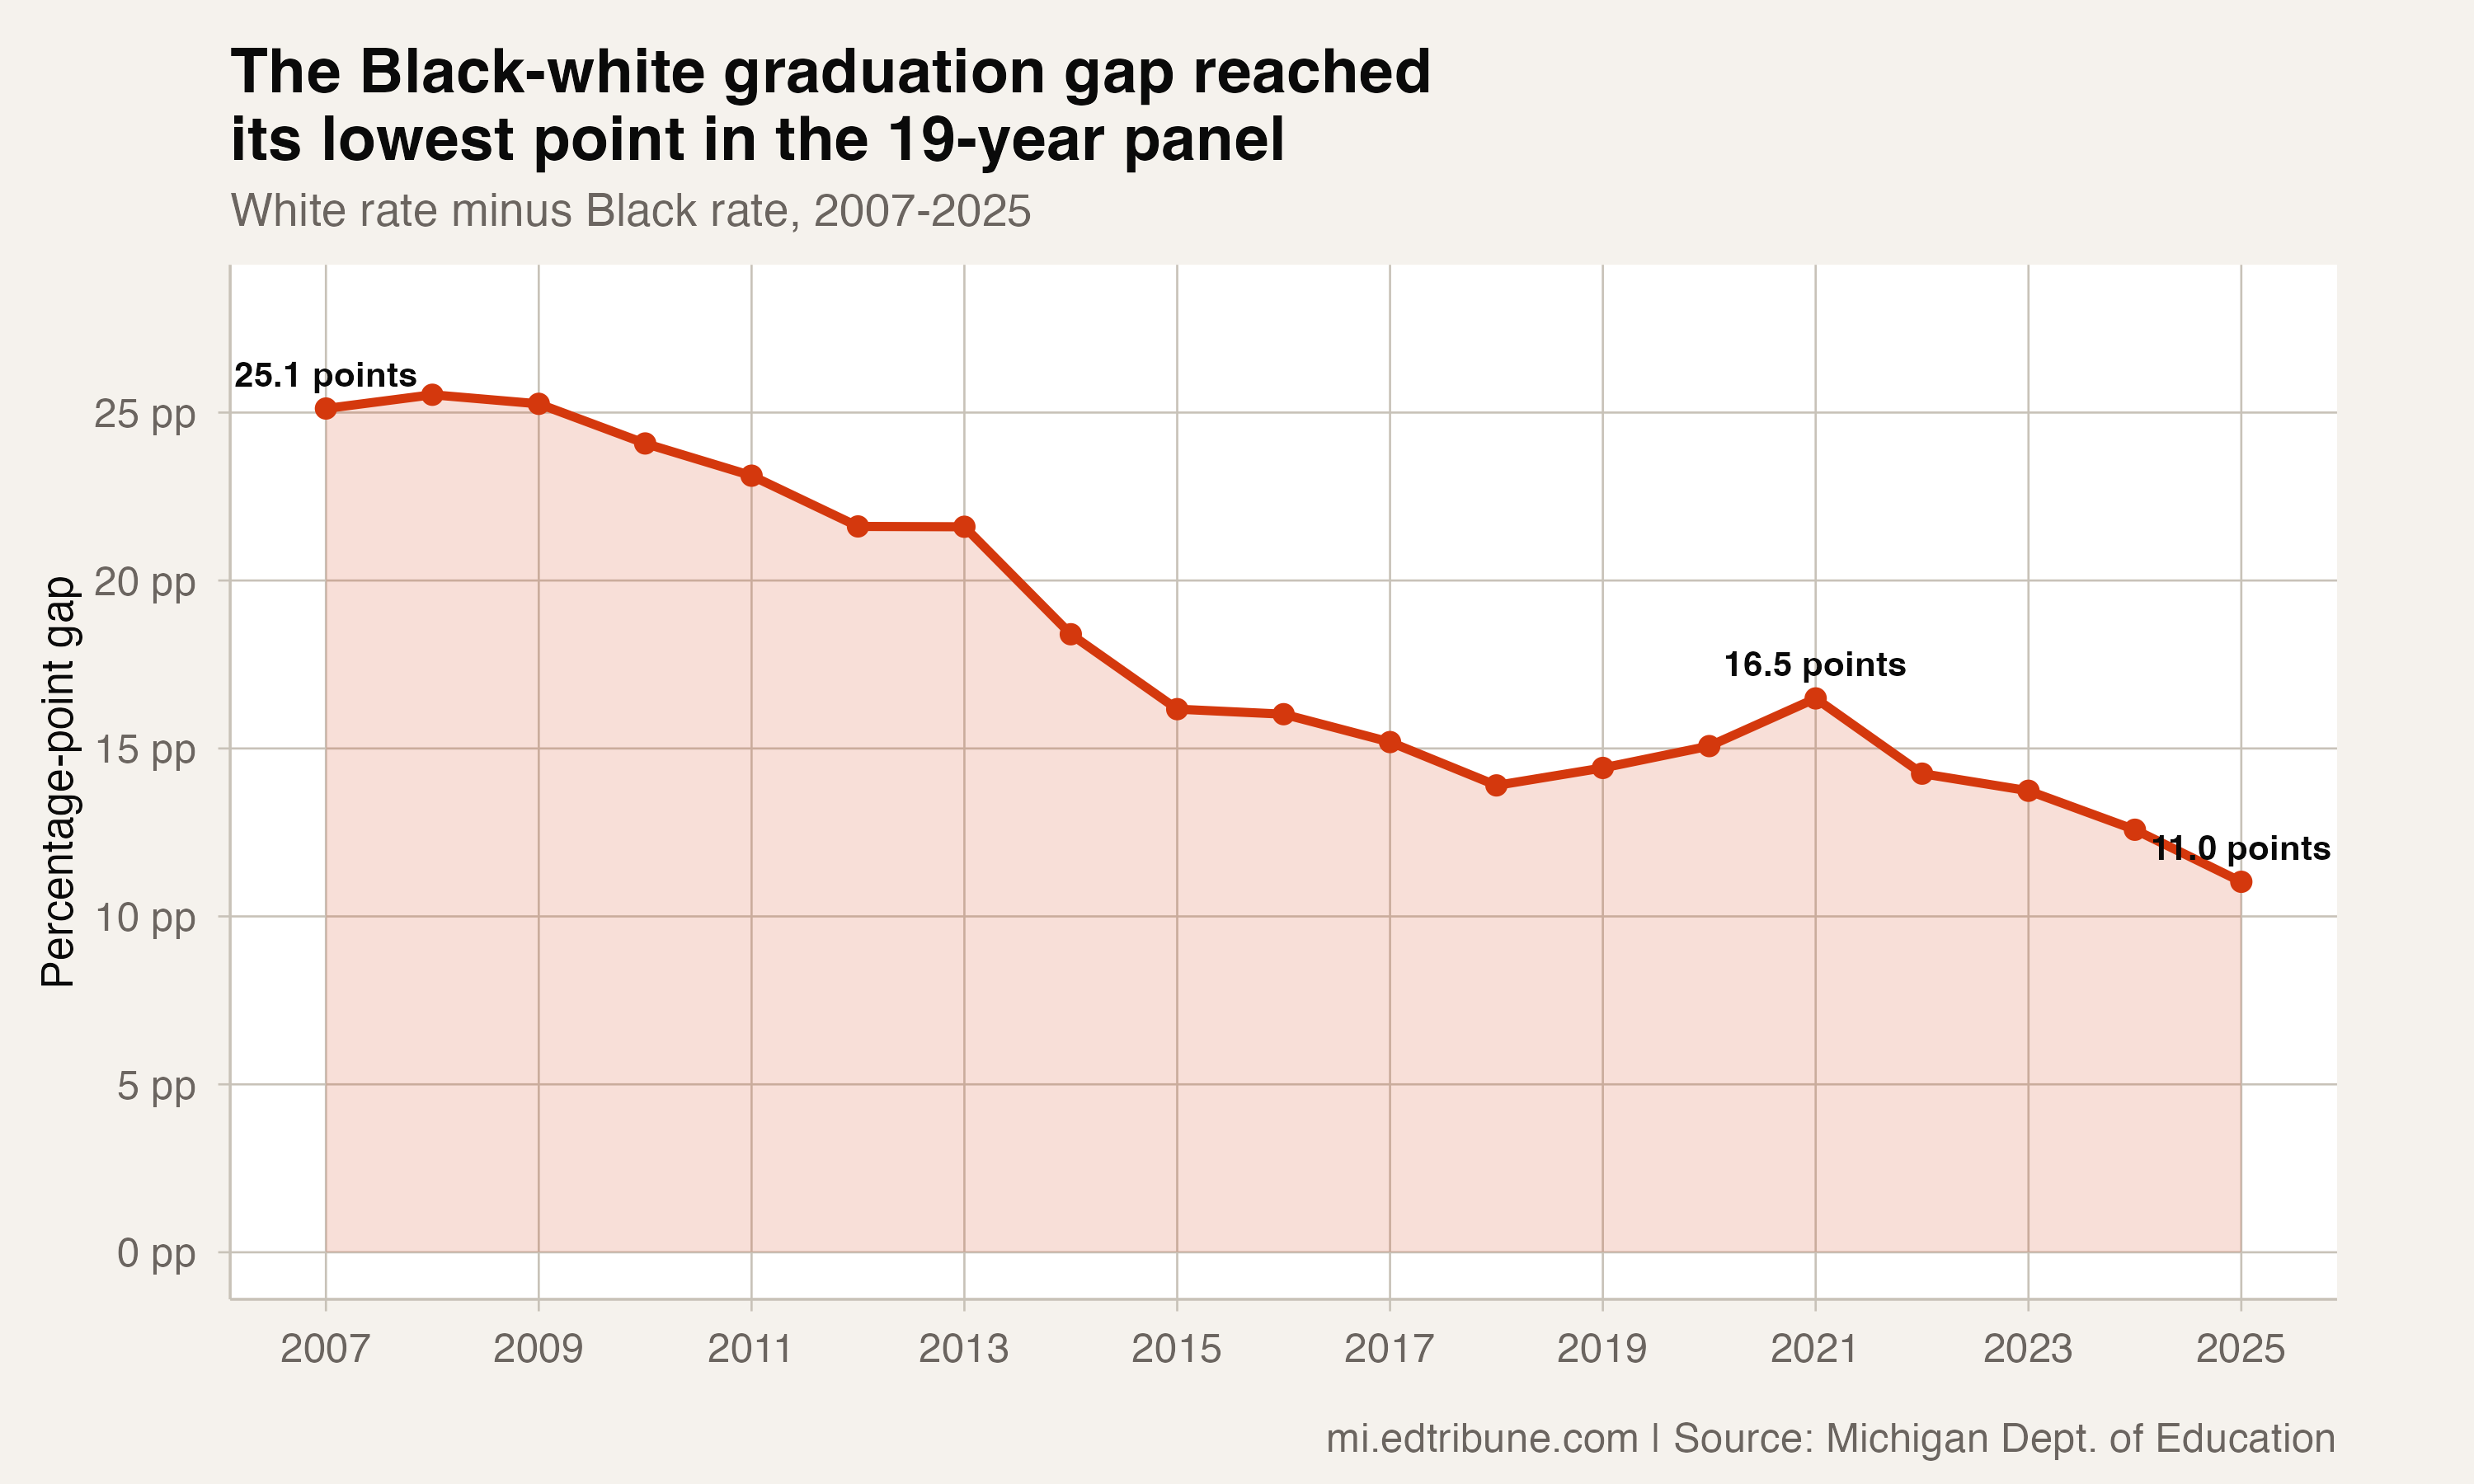
That changed the distance between the two rates from 25.1 percentage points to 11.0. The 14.1-point reduction narrowed the gap by 56.1%, and the latest gap is the smallest in the complete 19-reporting-year race panel.
Both student groups improved. The Black rate gained 19.3 points while the white rate gained 5.2. Michigan's remaining disparity is smaller because the Black rate rose faster, not because the white rate fell.
A setback, then four annual gains
The long-run change was not smooth. The Black graduation rate reached 70.4% in 2020, then fell 2.8 points to 67.6% in 2021. It rose in each of the next four reporting years and reached 75.7% in 2025, an 8.1-point gain from the 2021 low.
The gap widened from 15.1 points in 2020 to 16.5 in 2021. It then narrowed by 5.5 points through 2025. That latest result is both the highest Black graduation rate and the smallest Black-white gap in the panel.
One state rate, sharply different local results
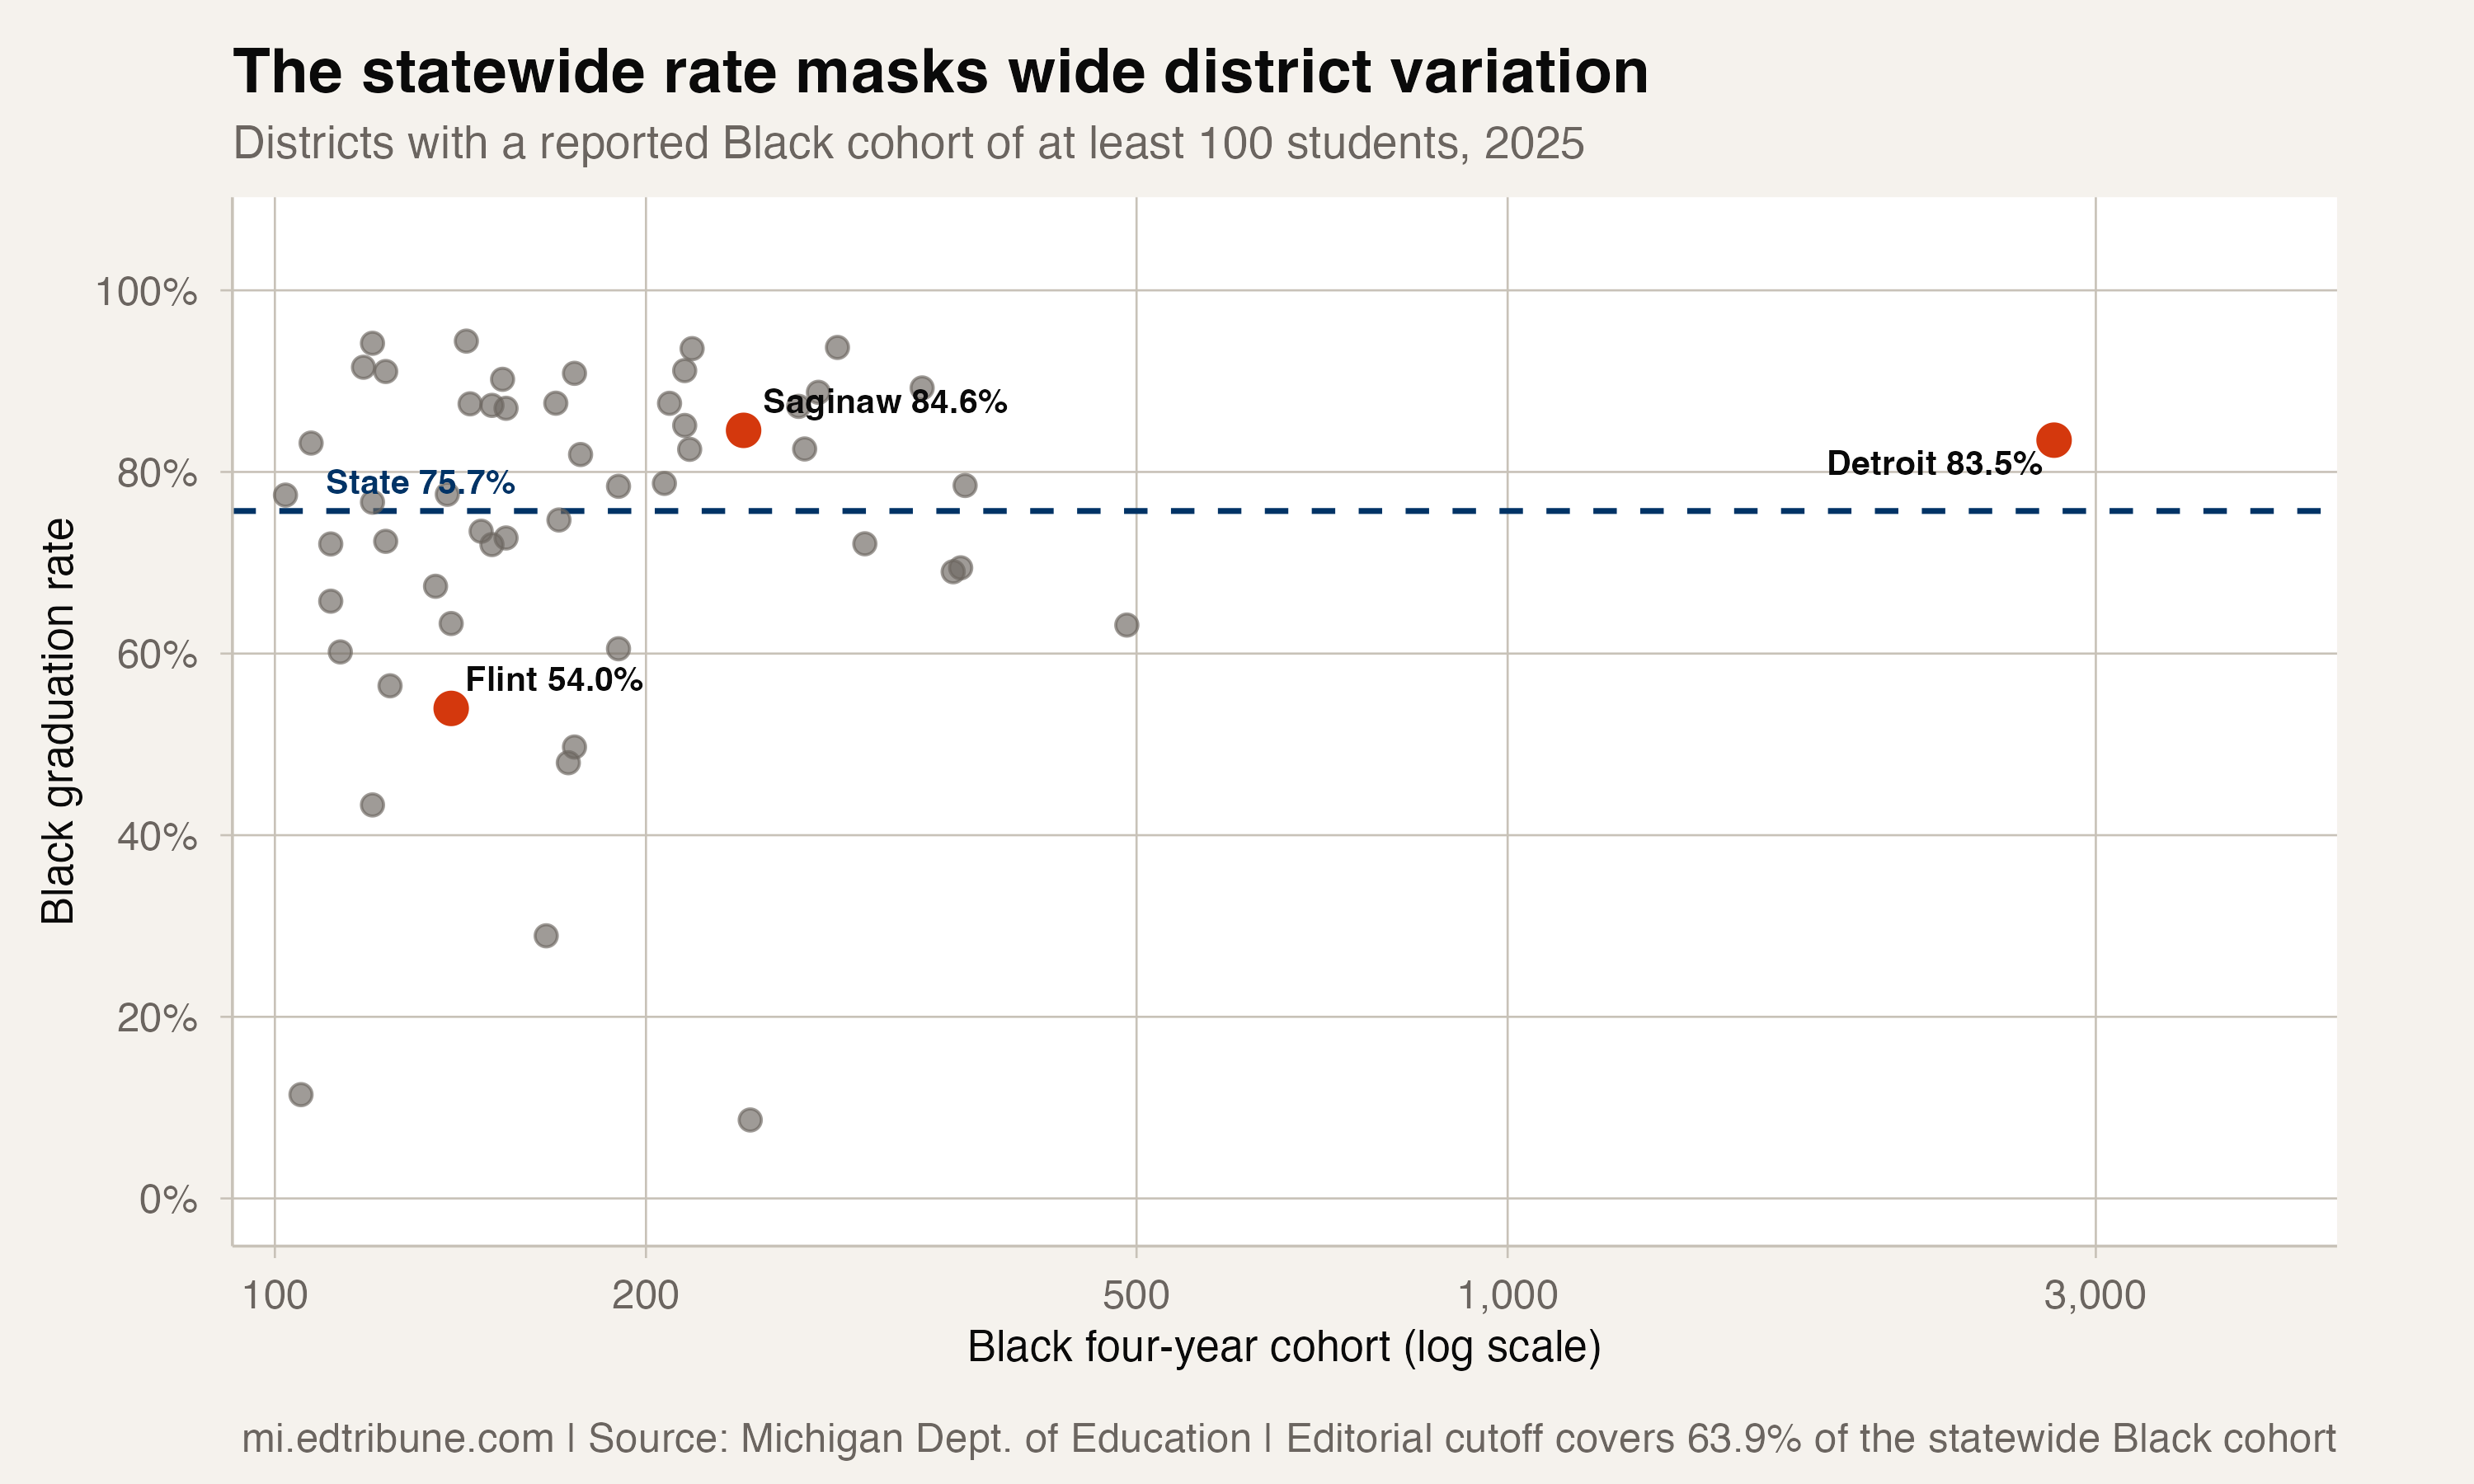
The statewide average does not describe every district. For a comparison with less volatility from very small cohorts, this analysis used an editorial cutoff of at least 100 Black students in a district's reported 2025 cohort. That produced 53 districts covering 12,669 of the statewide Black cohort's 19,821 students, or 63.9%.
Thirty of those 53 districts met or exceeded the statewide Black graduation rate of 75.7%. Detroit Public Schools Community District↗ET reported 83.5% for a Black cohort of 2,775 students. Saginaw, School District of the City of↗ET reported 84.6% for 240 students. Flint, School District of the City of↗ET reported 54.0% for 139 students.
The cutoff is an editorial comparison rule, not a state classification. At lower thresholds, more districts enter the comparison, but their smaller cohorts make a one-student change matter more to the rate.
What the rates establish
Direct evidence: Michigan's Black-white graduation gap narrowed substantially across the available panel, and the 2025 Black rate was the panel's highest. The district records also show that statewide progress was uneven.
Competing explanation: Differences among districts may reflect local programs, student mobility, cohort composition or reporting practices. The graduation records do not separate those possibilities.
Unresourced: The data cannot identify a single intervention that caused the statewide change. Claims about curriculum, credit recovery or support programs would require evidence beyond these rates.
The 2025 result carries both parts of Michigan's graduation story. The Black graduation rate is higher than in any other year in the panel, while 11.0 percentage points still separate it from the white rate.
Graduation-rate data comes from the official Michigan Department of Education's MI School Data Grad/Dropout Rate report.
This analysis uses state and district records covering 2007 through 2025. The trend uses the complete race-subgroup panel; the package's statewide all-students row is absent for 2021 through 2023, but the race rows are present and reconcile exactly in every year where the all-students row is available.
Detailed code that reproduces the analysis and figures in this article is available exclusively to EdTribune subscribers.
Discussion
Sign in to join the discussion.
Loading comments...